
WebFX’s Forecasting Approach
Our forecasting projections are prepared by seasoned experts using statistical data to help you better understand the potential growth from your marketing investment. With the help of machine learning technology, we use billions of data points to provide you with a more accurate forecast.
Advantages of WebFX’s forecasting approach
- Long-term view of forecast efficacy
- We’re able to track the accuracy of forecasts against actual campaign performance data in RevenueCloudFX and Nutshell.
- This 360-degree view gives us insights into making more accurate forecasts in dozens of industries.
- Proprietary data sets
- We’ve been tracking thousands of digital marketing campaigns performance in RevenueCloudFX for over a decade and rely on proven data to build forecasts.
- WebFX has a dedicated team of data scientists who build marketing campaigns and forecasts.
- Learning of Weekly and Annual Seasonality:
- Our forecasts factor in crucial weekly and annual trends specific to your business.
- Provides insights into recurring patterns over both short and long periods, enhancing forecast accuracy.
- Understanding the Difference Between Market and Seasonal Trends:
- Distinguishes between expected seasonal variations and broader market trends.
- Enables a nuanced understanding of fluctuations, aiding in strategic decision-making.
Learning the Effect of Local Holidays:
- Incorporates local holidays’ impact into predictions, improving contextual relevance.
- Enhances forecast precision by considering country-specific holiday schedules, reflecting local consumer behavior changes.
Where does the data come from?
Data is the most valuable resource for helping make more accurate forecasting predictions. At WebFX, we utilize first-party and third-party data to create forecasts.
First-party data forecasting
First-party data is data your company collects. This data comes from sources like Google Analytics, Google Search Console, and your customer relationship management (CRM) platform.
With access to first-party data, we use your company’s data to create more accurate forecasting predictions for your marketing investment. This type of data provides the most accurate forecasting.
Third-party data forecasting
If first-party data analysis is unavailable, we’ll use third-party data forecasting. We pull data from tools like Semrush, Ahrefs, and industry performance in RevenueCloudFX to help create a forecast for your marketing investment.
With third-party data forecasting, we’ll rerun the forecast once we have access to first-party data sources to verify your forecast is accurate and realistic.
Our Data Models
With the help of billions of data points from RevenueCloudFX, industry campaigns, and CRM data, we create data-backed sales forecasts for businesses. We use three different measurement systems to create these forecasts:
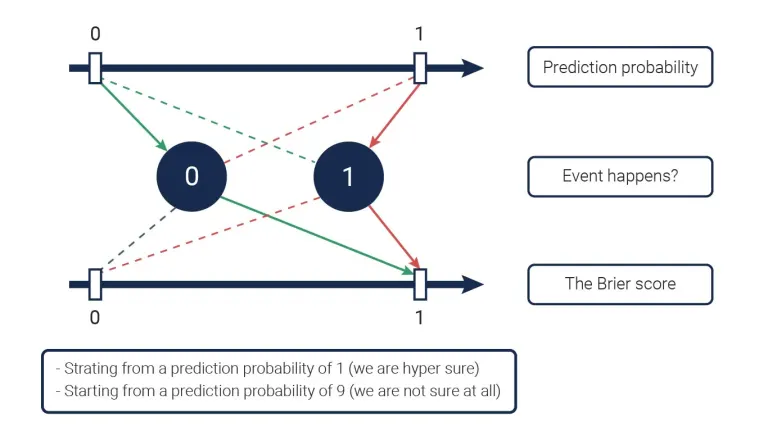
Brier Score
The Brier Score is a forecasting model that takes the forecaster’s confidence level into consideration. It factors the confidence of the predictor in the accuracy of their forecast. Essentially, if the forecaster has strong confidence, but the forecast is wrong, it has a bigger impact than if the forecaster had minimal confidence and the projection was wrong.
The score operates on a scale of 0-2, with 0 being the most accurate prediction and 2 being the least accurate. For example, if the forecast were 87 leads, with the forecaster having 76% confidence, and the end result was 91 leads, it would amount to a score of 0.11, which means the forecast was highly accurate.
Absolute Error Score
Absolute Error Score measures how close the forecast was to the projected outcome. The closer the score is to 0%, the more accurate the forecast is. For example, if the forecast was 87 new leads and the actual leads obtained was 91, it would be a 4.6% absolute error score, which means the forecast was fairly accurate.
Performance Differential Score
The Performance Differential Score works similar to the Absolute Error Score, except it focuses on campaigns performing beyond their forecasted numbers. Anything that performs under the forecasted amount is a negative score.
So if the forecasted number was 87 leads and a company earned 91 leads, the performance differential score would be 4.6%, which is considered fair.