50+ PPC Stats You Need to Know for 2026


If you want to stay competitive in the online advertising market, you’ll need to stay informed on the major PPC statistics for 2026.
Read on to discover 50+ impactful PPC stats and subscribe to our newsletter, Revenue Weekly, to stay connected on the latest PPC trends!
General pay-per-click statistics
Let’s take a look at some general PPC advertising statistics for 2026 that you need to know before diving into this strategy.
- $351.5 billion is the projected amount companies will spent on search advertising globally in 2025. (Source)
- $100 – $100,000 per month is the amount the average PPC campaign costs for small to mid-sized companies. (Source)
- $100 – $5,000 per month is how much businesses typically pay for PPC services from an agency. (Source)
- $2 for every $1 spent is how much businesses make on PPC. (Source)
- 72% of companies haven’t looked at their ad campaigns in over a month. (Source)
- 65% of small to mid-sized businesses have a PPC campaign. (Source)
- 81% say they research a product online before purchasing. (Source)
- 21% of the total global retail purchases are completed online. (Source)
- 39% is how much paid search accounted for in advertisers’ budgets. (Source)
- 32% of companies use PPC to sell products directly to consumers. (Source)
Search ads stats
PPC ads in search appear with a “Sponsored” label, and look otherwise the same as organic search results in SERPs. Below, you can see an example of a PPC ad that you’d see in search results.

Let’s take a look at how these PPC stats for 2026 showcase the relationship between search and paid ads.
- $9.21 is the highest average CPC for Google Ads, belonging to the legal industry. (Source)
- $1.55 is the lowest average CPC for search on Google Ads, belonging to the real estate industry and the arts and entertainment industry. (Source)
- $0.51 – $7 is the average cost per 1000 impressions (CPM) for Google Ads. (Source)
- 96% of advertisers spend money on search ads. (Source)
- 92% of the global search engine market is controlled by Google. (Source)
- 80% is about how much search ads can increase brand awareness. (Source)
- 65% of all high-intent searches result in an ad click. (Source)
- PPC traffic converts 50% better than organic site visitors. (Source)
- 45% of page clicks are earned by Ads that appear in search results. (Source)
- 46% of all clicks go to the top three pay-per-click (PPC) ads. (Source)
Display PPC stats
Display ads appear around the internet on various websites. They can appear in the headers of some websites, in sidebars, and even in text. They often look something like this:
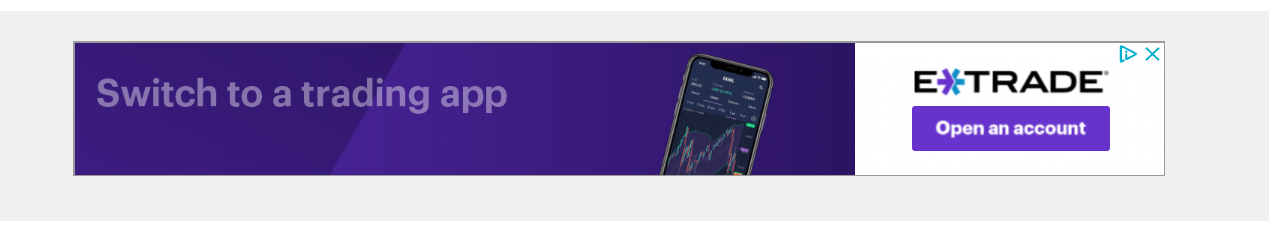
PPC is more than advertising in search results. These PPC statistics highlight another common PPC format, display ads, and how these ads impact businesses.
- $0.44 is the lowest average CPC for Google’s Display Network, belonging to travel and hospitality ads. (Source)
- $1.49 is the highest average CPC for Google’s Display Network, belonging to dating and personals. (Source)
- 97% of total digital display ad spending in 2026 is projected to be programmatic advertising. (Source)
Google pay-per-click statistics
Google is the most common place to run PPC ads. Look at these PPC stats for 2026 that give you insight into advertising on Google!
- Google Ads is currently the biggest provider of search advertising on the market. (Source)
- $264.59 billion is what Google’s ad revenue amounted to in 2024. (Source)
- $100 - $10,000 per month is how much businesses typically pay for Google Ads. (Source)
- $8 for every $1.60 spent is what businesses earn on average with Google Ads. (Source)
- $0.01 – $1 is Google’s average CPC. (Source)
- 80% of all companies focus on Google Ads for PPC. (Source)
- 62% of all core search queries in the United States are generated by Google. (Source)
Amazon PPC stats
You can also choose to advertise your products on Amazon. Similarly to Google Shopping Ads, Amazon PPC ads allow users to click the product and purchase easily.

If you have products you’re selling on Amazon, check out these PPC statistics to get insight on advertising on Amazon!
- Amazon is the third most popular advertising platform. (Source)
- There are over 9.7 million Amazon Sellers worldwide. (Source)
- $56.21 billion is what Amazon earned in net U.S. digital ad revenues in 2024. (Source)
- $0.77 is Amazon’s average CPC. (Source)
- 12% of the total ad spending is Amazon’s U.S. ad search revenue share. (Source)
Social media pay-per-click statistics
You can also advertise your products on social media platforms like Facebook, Twitter, Instagram, and more. Social media ads show up differently on each platform, and you can choose from a variety of locations to advertise, like stories and feeds.
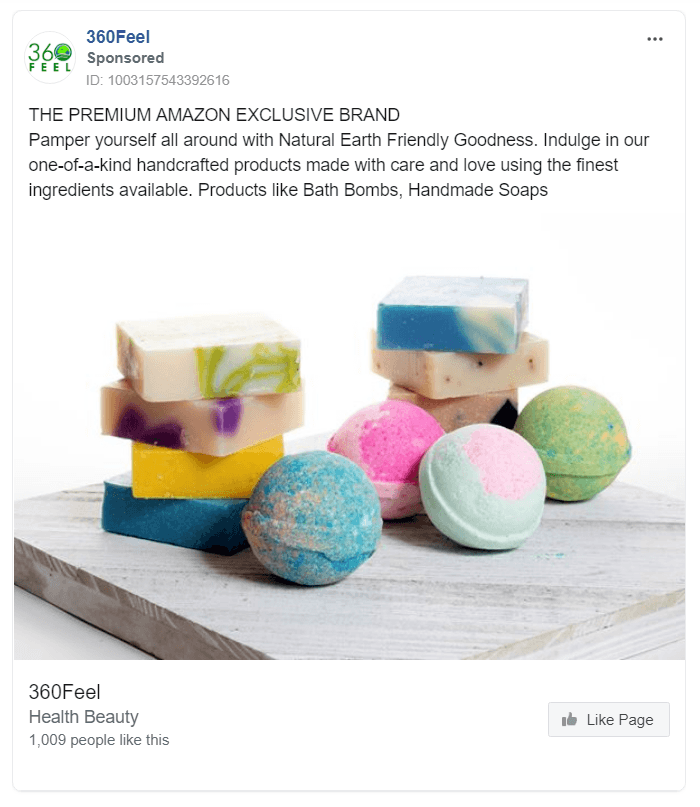
Social media platforms are a great place to reach new leads. Check out these PPC statistics that provide insight on advertising through social media!
- $160 million was Facebook’s ad revenue in the US in 2024. (Source)
- $276 billion is the projected social media ad spend in 2025. (Source)
- 65% of B2B companies have acquired customers through LinkedIn ads. (Source)
- 48% of U.S. user’s social media users use Pinterest for finding and shopping for products. (Source)
- 37% of Instagram users answered that the content of sponsored ads matches their interests most of the time. (Source)
- 26% of social marketers in the U.S. are using TikTok. (Source)
Mobile PPC advertising statistics
As mobile becomes more popular, you must adapt your paid advertising strategy to reach mobile users. Check out these PPC stats that focus on advertising on mobile!
- More than 615 million devices have ad blockers. (Source)
- $625 billion is the amount of revenue that mobile apps are expected to generate in 2026 via paid downloads and in-app advertising. (Source)
- $202 billion is how much mobile advertising spend reached in 2024. (Source)
- 95% of paid search ad clicks on mobile is driven by Google. (Source)
- 70% of U.S. search ad impressions are on mobile devices. (Source)
- 69% of smartphone owners use them for shopping. (Source)
- 60% of mobile users click on a PPC ad at least once per week. (Source)
- 53% of PPC ad clicks come from mobile devices. (Source)
User behavior PPC stats
Are you curious to know how customers interact with your ads? Check out these PPC statistics to get insight into how users engage with PPC ads!
- $58.21 is the projected average ad spending per Internet user in the search advertising market for 2025. (Source)
- 75% of people say paid ads make it easier to find what they need. (Source)
- 60% of people can’t identify ads in search engine results pages. (Source)
- 50% of users can’t tell the difference between paid results and organic results. (Source)
- 50% is how much more likely PPC visitors are to buy than organic visitors. (Source)
Get actionable PPC strategy advice with WebFX
Want help incorporating these PPC advertising statistics into your marketing strategy? Get it with WebFX’s award-winning pay-per-click consulting services.
Our 750+ PPC advertising experts have generated over $10 billion in revenue for our clients in the past five years. We’ll help you build the perfect PPC campaign.
Contact us online or call us at 888-601-5359 for a custom proposal!