60 Education Industry Statistics to Grow Your Academic Knowledge
Whether you’re trying to boost enrollment at your higher education organization or understand the industry, having the leading education statistics can help you accomplish your goal.
-
 insights from 61,900+ hours of higher education marketing experience

Table of Contents
- E-learning statistics
- Global e-learning statistics
- Academic e-learning statistics
- Business e-learning statistics
- Higher education statistics
- Statistics on college enrollment by institution
- College enrollment by age
- College enrollment by degree
- Upskilling and reskilling programs statistics
- High school statistics
- Private school statistics
- Public school statistics
- High school graduation statistics
- Use the education industry statistics to increase your enrollment rate with WebFX
- We Drive Results for Higher Ed Centers
This page will break down the top education industry statistics to help you learn more about enrollment, student success and behaviors, and more.
Let’s explore the latest education statistics in more detail through the following sections:
- E-learning statistics
- Higher education statistics
- Upskilling and reskilling programs
- High school statistics
Read on below!
E-learning statistics
E-learning statistics give essential information on the development and influence of online learning platforms. These figures provide insight into the changing educational scene, including the number of people taking online courses and the range of disciplines offered.
Let’s examine the most recent e-learning statistics to see how this delivery method alters learning for students and postgraduates alike.
Global e-learning statistics
1. The e-learning market is expected to be worth over $1 trillion in 2032.
2. The number of online learners is growing by over 20% annually.
3. There has been a $34.3 billion increase in the market, primarily for mobile e-learning.
4. E-learning is estimated to be worth $325B in 2025.

Academic e-learning statistics
5. 25–60% of students take in more material when learning online compared to conventional methods.
6. 41% of college students say e-learning is more effective than classroom teaching.
7. 47% of students in higher education agreed that the quality of online instruction in higher education is the same as the quality of in-person instruction in the United States, while 43% said that the quality was worse.
8. 3 in 4 K-12 schools in the US are rolling out a completely online or a hybrid model.
Business e-learning statistics
9. In the U.S., 68% of employees prefer to learn at work.
10. 42% of companies reported increased income generation when utilizing e-learning modules.
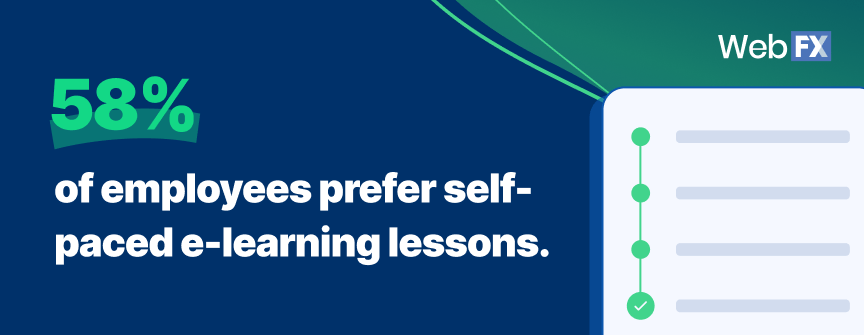
11. 58% of employees prefer self-paced e-learning lessons.
12. 92% of employees agree that well-planned employee training programs have a positive impact on their engagement.
13. Employee engagement increases by 18% for businesses that implement e-learning.
14. 80% of businesses now offer online learning or training solutions.
15. Online learning and training can improve employee performance by 15% to 25%.
Higher education statistics
Higher education is essential for influencing people’s careers and advancing a nation’s growth. We can learn more about the present condition of higher education and pinpoint opportunities for improvement by looking at numerous associated data points, such as enrollment rates, graduation rates, and job outcomes. Let’s examine the latest higher education statistics.
Statistics on college enrollment by institution
16. Among new high school graduates, 16% enroll in 2-year colleges, while 45% enroll in 4-year programs.
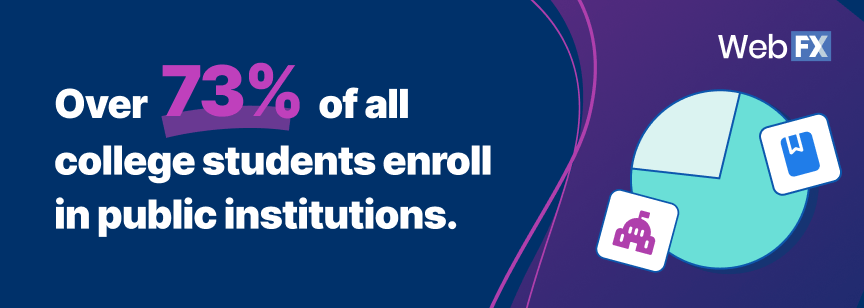
17. Over 73% of all college students enroll in public institutions.
18. 47.6% of post-traditional students reported having dependent children, compared to just 3.4% of traditionally aged students.
19. 27% of college students attend private institutions — 80% attend non-profits, and 20% attend for-profits.
20. Around 5.09 million students were enrolled in private colleges in 2022.
21. Among the undergraduates who attend private institutions, 78.4% attend nonprofit schools.
22. In fall 2023, almost 18.1 million students were enrolled in degree-granting colleges and universities in the US.
College enrollment by age
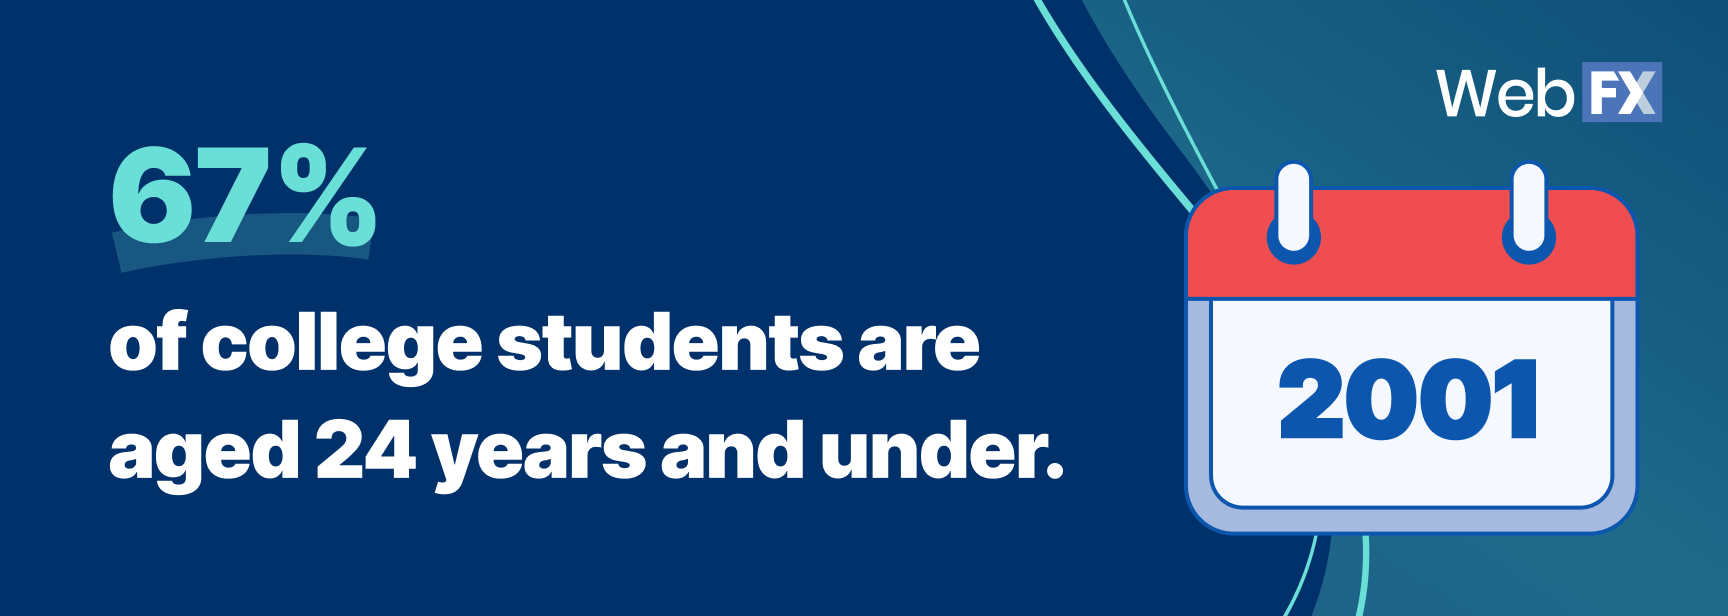
23. 67% of college students are aged 24 years and under.
24. 39% of Americans between 18 and 24 go to postsecondary schools.
25. 10% of all U.S. citizens aged 25–34 attend higher education institutions.
25. 4.1% of adults between 30 and 34 are taking college courses.
26. 1.69% of people aged 40 to 49 are currently enrolled in college.
27. 0.54% of adults aged 50 to 64 are registered students.
28. 57% of graduate students are under 30.
College enrollment by degree
29. 82.9% of postsecondary students are undergraduates. The remaining 17.1% are in graduate programs.
30. Of the 4.43 million college students that graduated in 2021:
- 6% earned associate’s degrees.
- 9% obtained bachelor’s degrees.
- 8% received master’s degrees.
- 7% graduated with doctorates or professional degrees.
31. About 94% of certificates and 57% of associate’s degrees awarded are in career-oriented fields.
32. 50.8% of all bachelor’s degrees earned in 2021 were in six fields:
- Business (391,400 degrees)
- Health professions and related programs (268,000 degrees)
- Social sciences and history (160,800 degrees)
- Biological and biomedical sciences (131,500 degrees)
- Psychology (126,900 degrees)
- Engineering (126,000 degrees)
Upskilling and reskilling programs statistics
Upskilling and reskilling programs are essential in assisting people with acquiring new skills or improving their current ones to meet the needs of a labor market that is constantly changing.
Here are a few statistics on upskilling and reskilling that show how it benefits ongoing learners:
33. 71% of workers said that they were satisfied or very satisfied with their company’s reskilling and upskilling training.
34. 40% of workers will require up to six months of reskilling as of 2024.
35. 94% of business leaders expect their workers to pick up new skills.
36. 93% of CEOs who introduce upskilling programs see increased productivity, an improvement in talent acquisition and retention, and a more resilient workforce.
37. Companies are 17% more productive when employees get the training they need.
38. Companies that emphasize employee development will yield 218% higher income per employee.
High school statistics
Statistics are essential for understanding and evaluating data, and studying them may allow us to learn things that will benefit high school pupils. So, let’s delve into high school statistics to learn their significance and applicability.
Private school statistics
39. The United States has 2,845 private high schools.
40. 9% of private schools use the Montessori program, while 68% adhere to the traditional secondary or element format.
41. Around 4.7 million K–12 students are enrolled in private schools.
42. Of those 4.7 million K–12 students:
- 65% were White
- 12% were Hispanic
- 9% were Black
- 6% each were Asian and of Two or more races
- 1% each were American Indian/Alaska Native and Pacific Islander
Public school statistics
43. Public school classes have an average of 24 students.
44. Public schools have an average 15:1 student-to-teacher ratio.
45. 7% of public schools are charters.
46. 85% of students who attend public high schools graduate.
47. 46.6% of white students are enrolled in public schools.
48. 2.7 million students are Asian, 0.5 million are American Indian or Alaska Native, and 0.2 million identify as Pacific Islanders.
49. Maine has the lowest average class size, at 13.6 students per secondary school classroom.
50. Nevada has the highest average class size, at 27.6 students per secondary school classroom.
High school graduation statistics
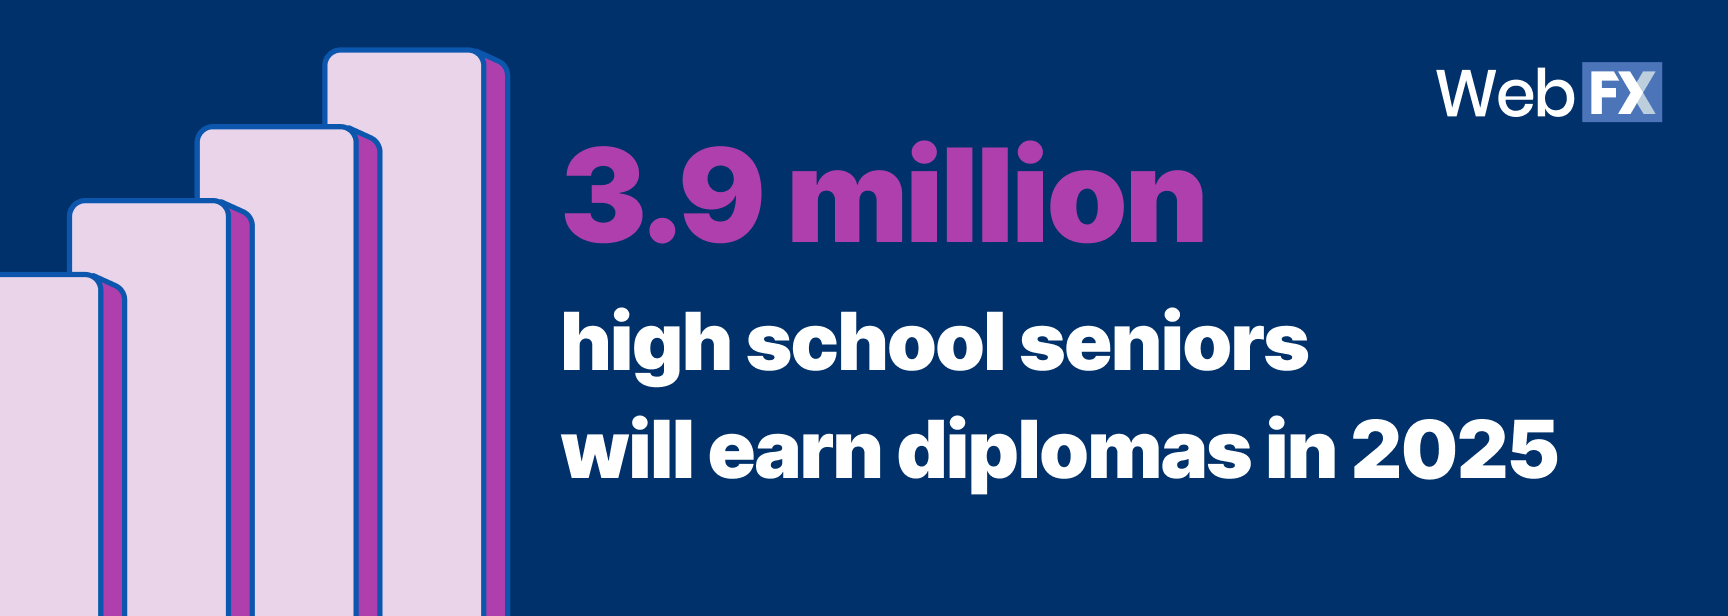
51. 3.9 million high school seniors will earn diplomas in 2025.
52. 365,000 students graduated from high school in the year 2020.
53. 85.3% of students graduate on time in the United States.
54. 52% of states have seen an improvement in graduation rates since 2019.
55. 81% of Hispanic, 79% of African-American, and 89.7% of Caucasian students finished on time.
56. Students with impairments continue to graduate at a rate of 67.1%.
57. The U.S. average adjusted cohort graduation rate (AGCR) for public high school students increased overall from 80% in 2011–12 to 87% in 2021–22.
58. Washington, D.C. has the lowest high school graduation rate at 73%.
59. In 2022, there were 2.1 million high school dropouts between the ages of 16 and 24.
60. In 2022, about 45% of high school graduates immediately enrolled in 4-year institutions and 17% immediately enrolled in 2-year institutions.
Use the education industry statistics to increase your enrollment rate with WebFX
WebFX is a top digital marketing agency that excels at boosting educational institution enrollment. We have the experience and knowledge to help your school increase applications and registrations by attracting and engaging potential students.
Our team of seasoned marketers will develop a digital marketing strategy for your school — a university, college, trade school, or online learning platform — to ensure it fits your budget.
Contact us online or call 888-601-5359 to speak with a strategist about how we can assist you in achieving your enrollment goals.
We Drive Results for Higher Ed Centers
- 188+ education industry experts
- Renowned for our communication and transparency


Table of Contents
- E-learning statistics
- Global e-learning statistics
- Academic e-learning statistics
- Business e-learning statistics
- Higher education statistics
- Statistics on college enrollment by institution
- College enrollment by age
- College enrollment by degree
- Upskilling and reskilling programs statistics
- High school statistics
- Private school statistics
- Public school statistics
- High school graduation statistics
- Use the education industry statistics to increase your enrollment rate with WebFX
- We Drive Results for Higher Ed Centers
Solving key challenges for higher education
We’re not driving enough traffic to our school’s website
Need to get more prospective students or even alumni to visit your website? Our team will help you increase your website’s rankings in the search results when potential students search for your courses online, alumni look for the latest news, and more.

We’re opening a new campus
Set your new campus (or even program!) for success with revenue-driving digital marketing strategies that boost your new school’s online visibility and spread the word so you can fill your building with new students.

We’re not attracting new students
Need to grow enrollment rates? Get access to highly targeted advertising campaigns and effective marketing strategies that reach your target audience where they spend their time online and encourage them to become students.

We’re struggling to secure funding
Not securing enough funding from alumni or donors? Our experts can help get your school in front of prospective donors’ eyes so you can secure the funding you need to run your school and classes.
