
“Everyone who has a website should use Google Analytics.”
There’s a good chance you’ve heard a sentiment like that before. But getting started with Google Analytics 4 is easier said than done, at least until you’ve had someone walk you through the process.
Whether you’ve yet to sign up for Google Analytics, or you set it up but haven’t started taking advantage of all of its features, this guide is for you. In this Google Analytics guide, we’ll cover:
If after reading this article, you’re still feeling lost, consider working with the digital marketing experts at WebFX! We can help with Google Analytics consulting and closed-loop analytics to ensure that your business is set up for success in 2025 and beyond!
Learn More: WebFX Digital Marketing Services
What is Google Analytics?
Google Analytics, commonly referred to as GA4, is a free tool from Google that enables you to analyze the performance of your website. It provides you with in-depth data and analytics reports about your traffic sources, how people interact on your website, the pages they view, and more.
Google Analytics also integrates with other Google tools such as Google Search Console, Google Ads, and Google Data Studio.
Universal Analytics (UA) vs. GA4: What’s the difference?
Before GA4, there was Universal Analytics. Universal Analytics was Google’s old model for processing data through Google Analytics. By July 2023, Universal Analytics was phased out and Google Analytics 4 became the new model.
So, how do they differ?
Overall, GA4 is very similar to Universal Analytics. It processes a lot of the same data and provides similar insights. There are a few differences between the models.
GA4 uses “events”
In Google Analytics 4, the interactions on your website are labeled as “events.” Previously, UA recorded actions as “hits,” and there were multiple hit types, like page view and social. Now, GA4 measures everything as an “event” and there are no “types”.
GA4 offers new data streams
A big difference between UA and GA4 is that GA4 offers data streams. Previously, UA had account, property, and view levels. GA4, however, only has an account and property level, and the property level is different than it was in UA.
Here’s how they compare:
| Levels | Universal Analytics | Google Analytics 4 |
| Account | The account that manages your Analytics properties | The account that manages your Analytics properties |
| Property | Your digital property, like a website or an app | Your digital property, like a website, an app, or a combination of both |
| View | Where the data was viewed | N/A |
Aside from the “view” level no longer being part of GA4, the biggest difference is at the property level. At the property level, you can opt to have separate streams and properties for a website and an app, or you can combine the data from a website and app to create a unified picture of your data.
Essentially, the data from the website and app remain as unique data streams, but they’re combined under one main property to create a better understanding of your overall performance.
So, for example, if you have a discount coupon code app and create a website just to promote that app, you can combine the data from these two data streams to get a better idea of your performance, rather than viewing the data separately on separate properties.
What can Google Analytics 4 show me?
Next in this Google Analytics guide, let’s talk about what GA4 can show you. Google Analytics provides a wealth of data about how your website or app performs, and most of this data is available for free.
It does take time to figure out how to take full advantage of the program’s features, but you’ll gain access to valuable insights once you do.
Here’s what GA4 can show you:
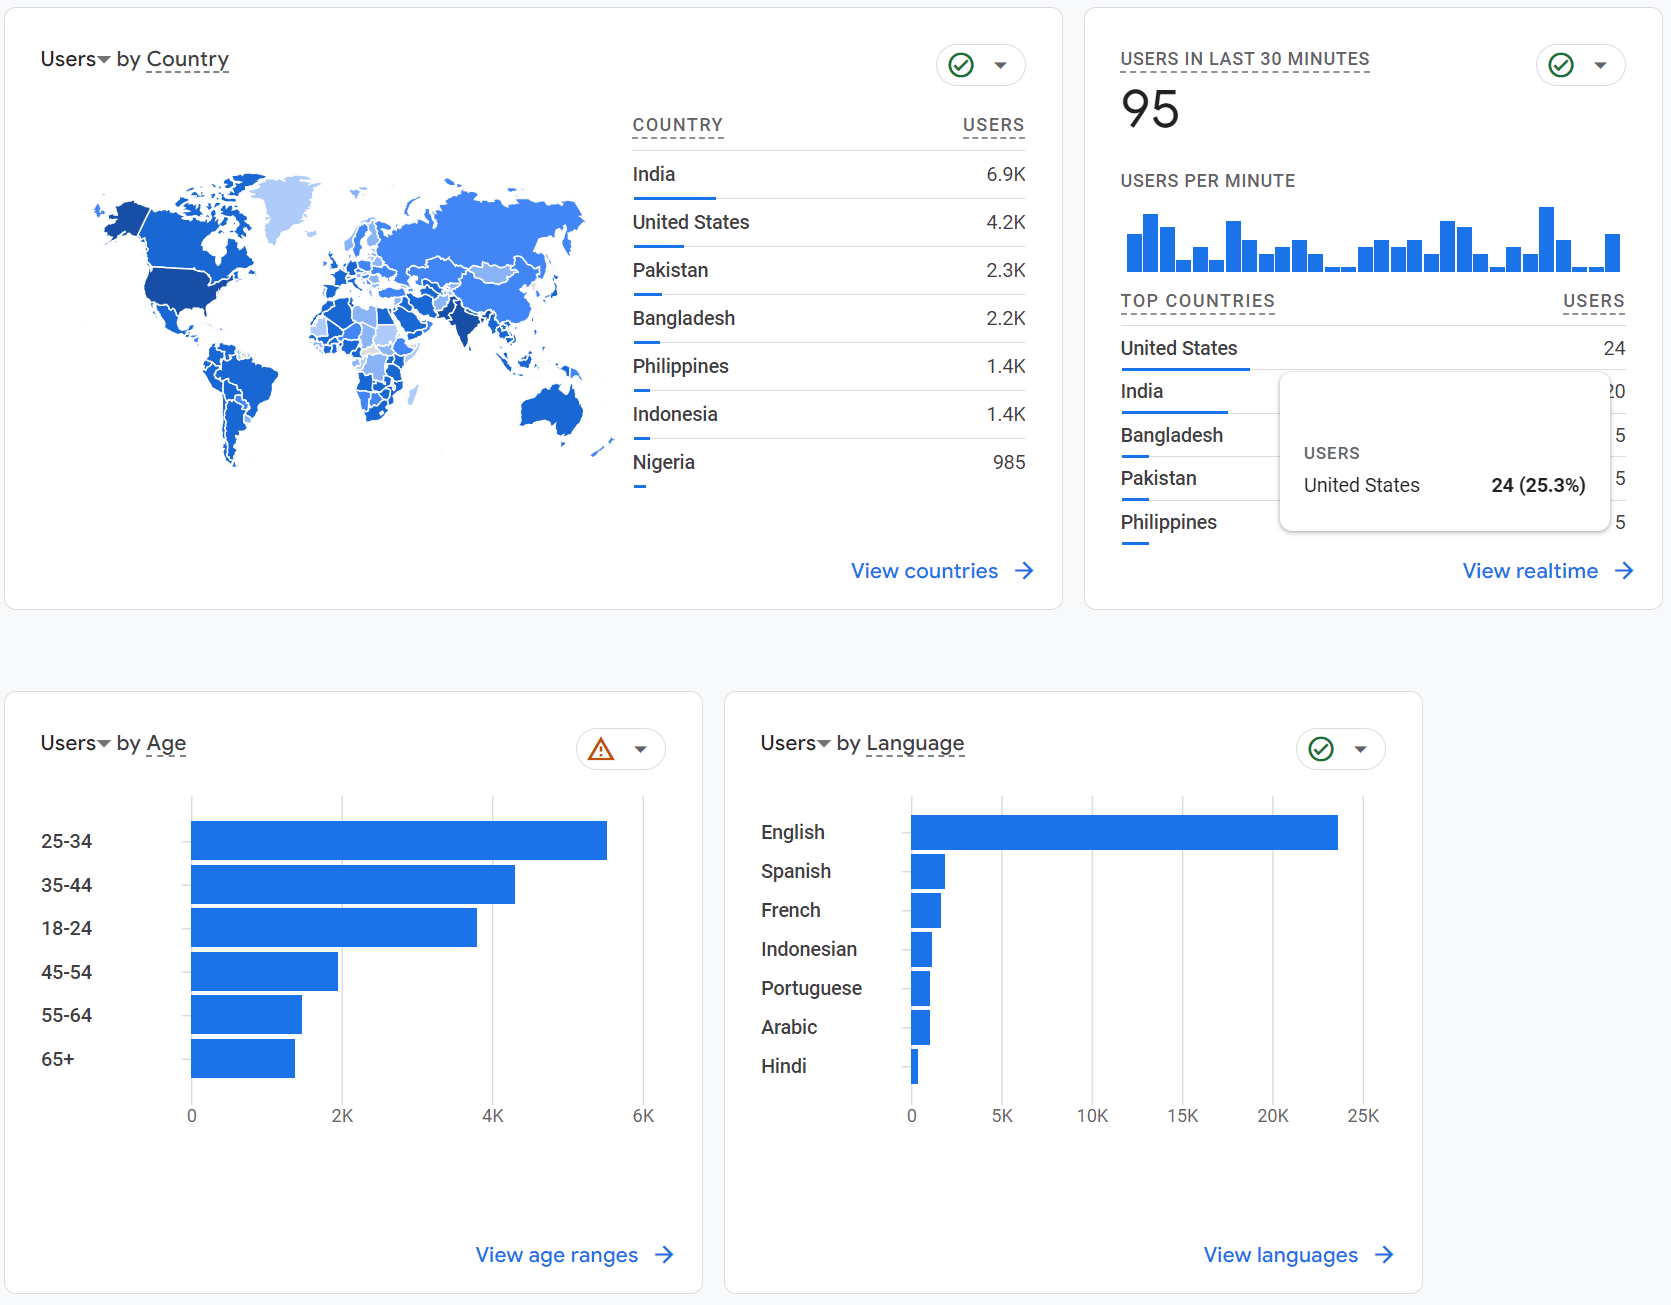
Who was on your website/app
Google Analytics 4 provides you with tons of details about who was on your website. You can see data like:
- What city they’re from
- What country they’re from
- Demographics like age, language, and gender
- Audience interests (technology, sports & fitness, shopping, etc.)
How users interact with your website/app
Google Analytics 4 provides you with details on how people interact with your website or app.
You can see valuable data like:
- What pages people viewed
- Average engagement time
- User app activity over time
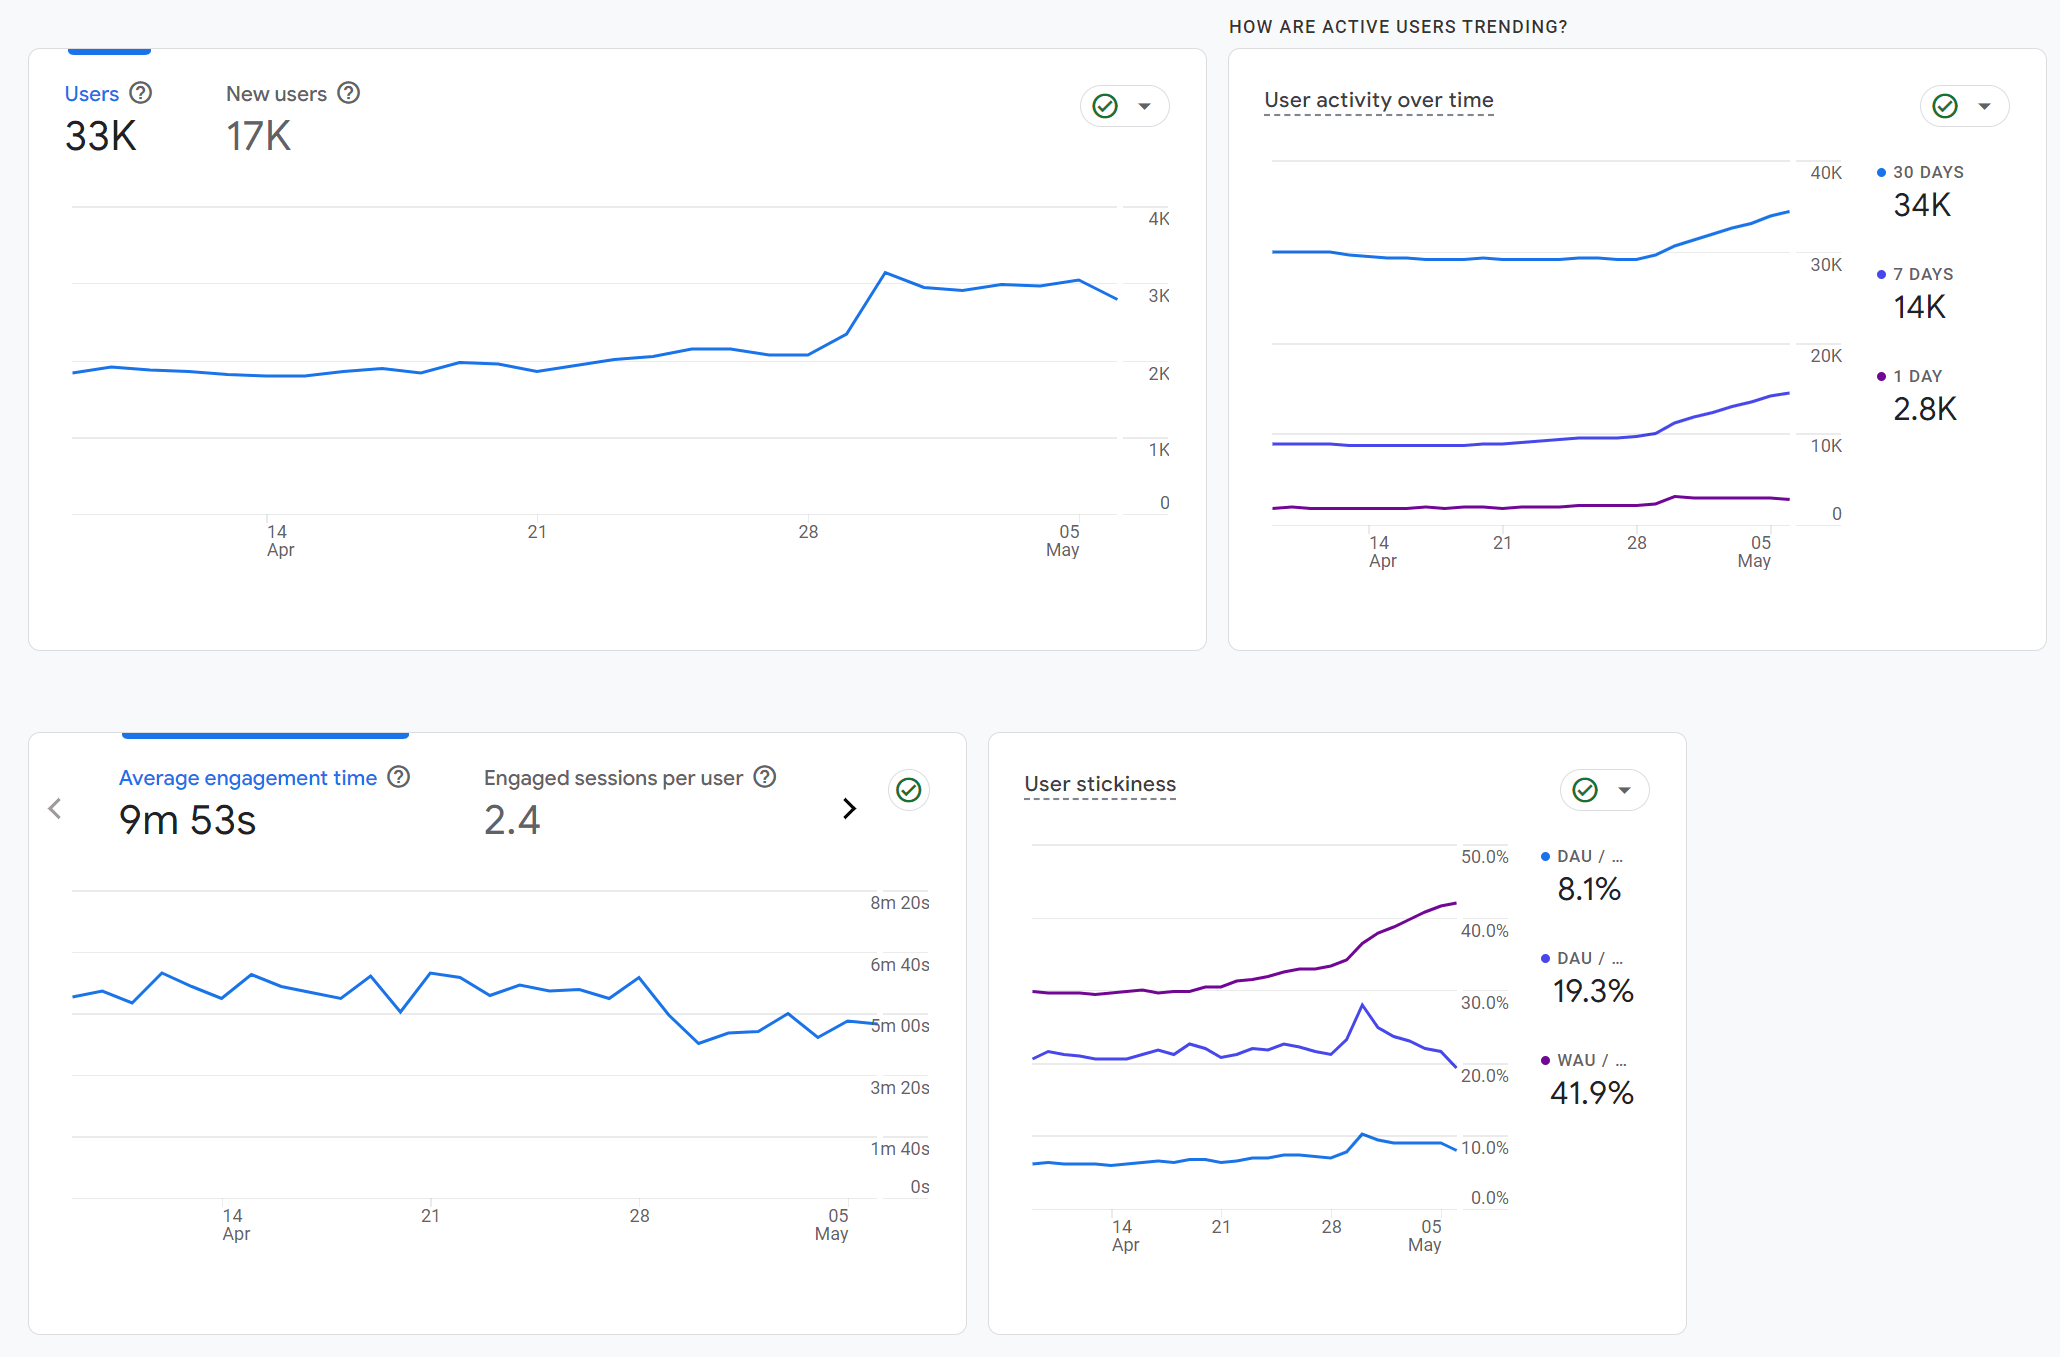
This data helps you understand what users do once they get on your website, so you can better understand your audience.
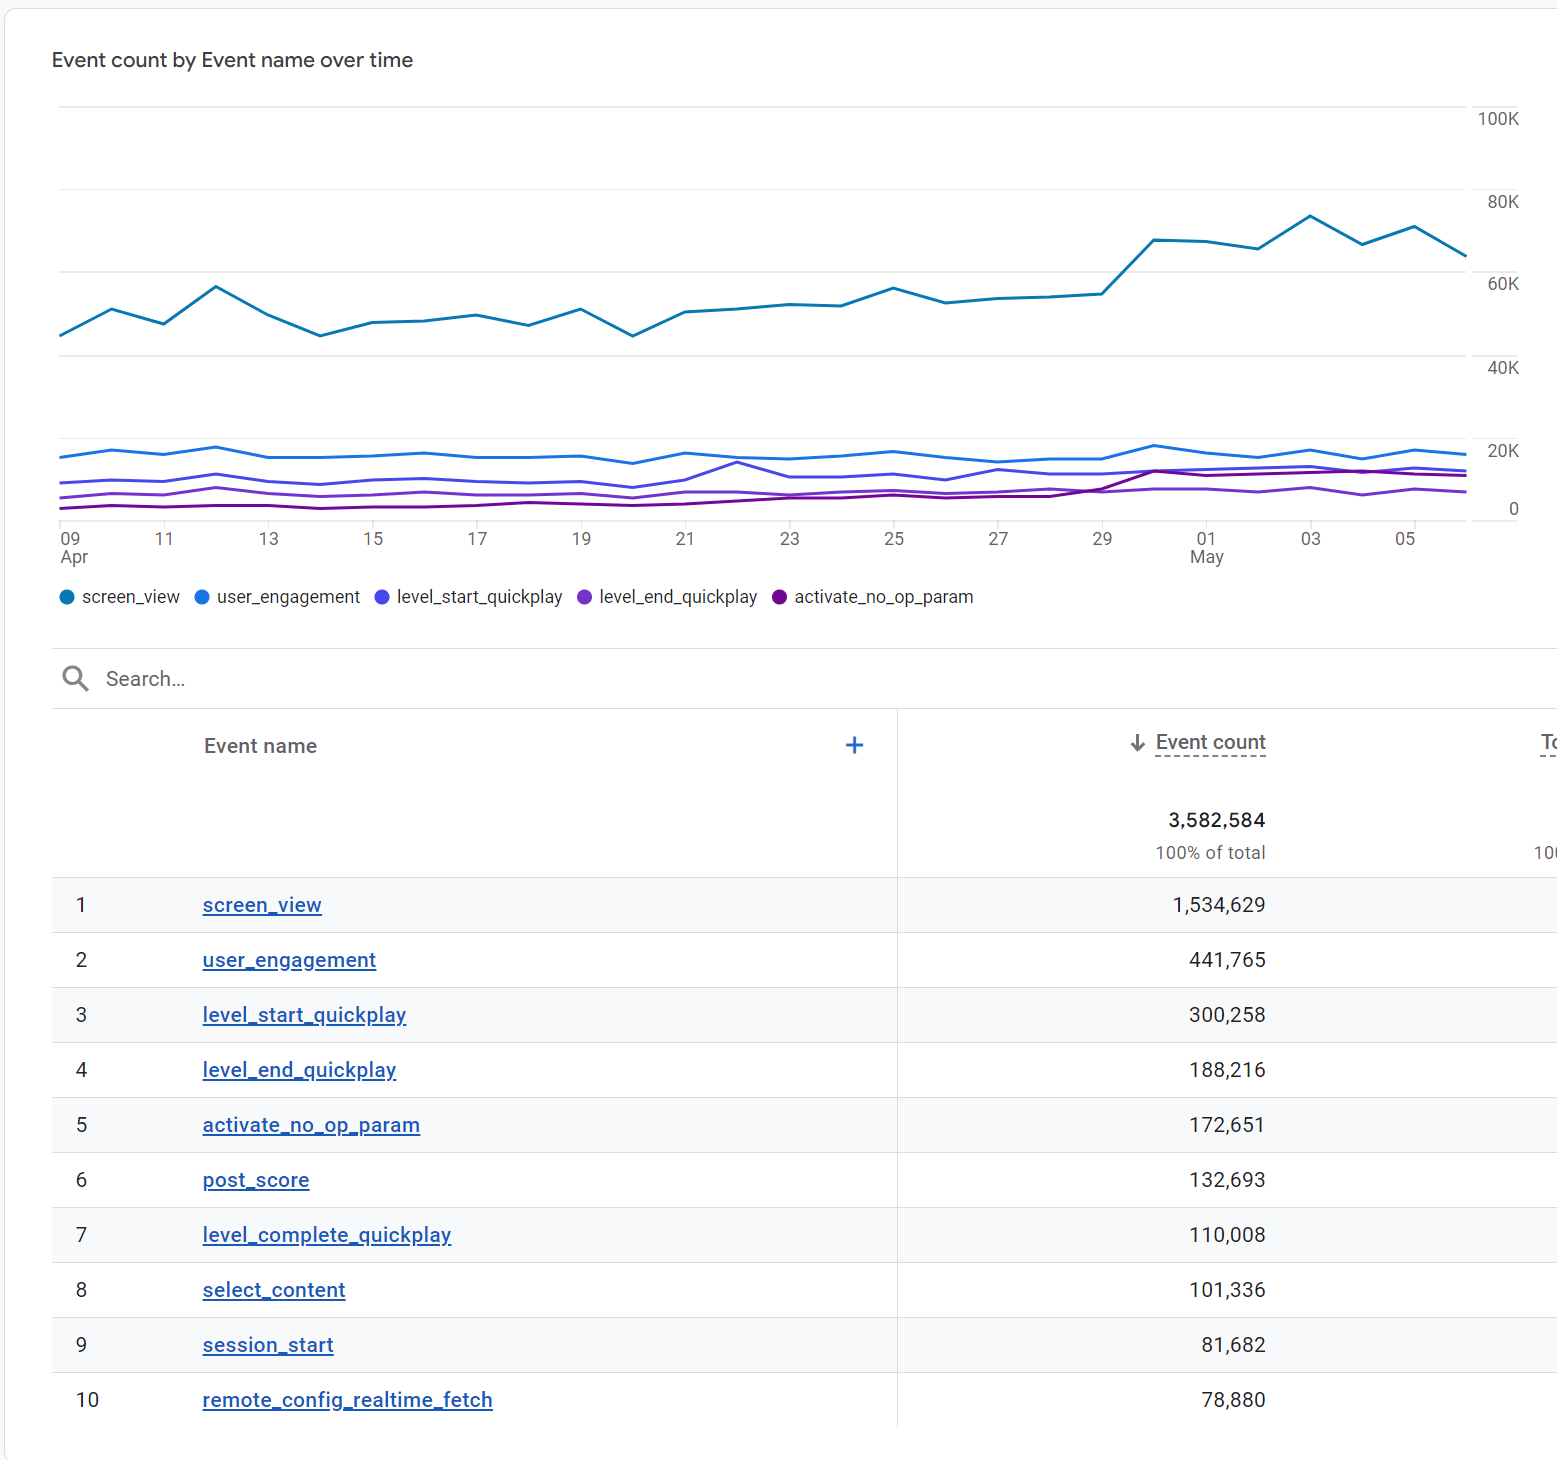
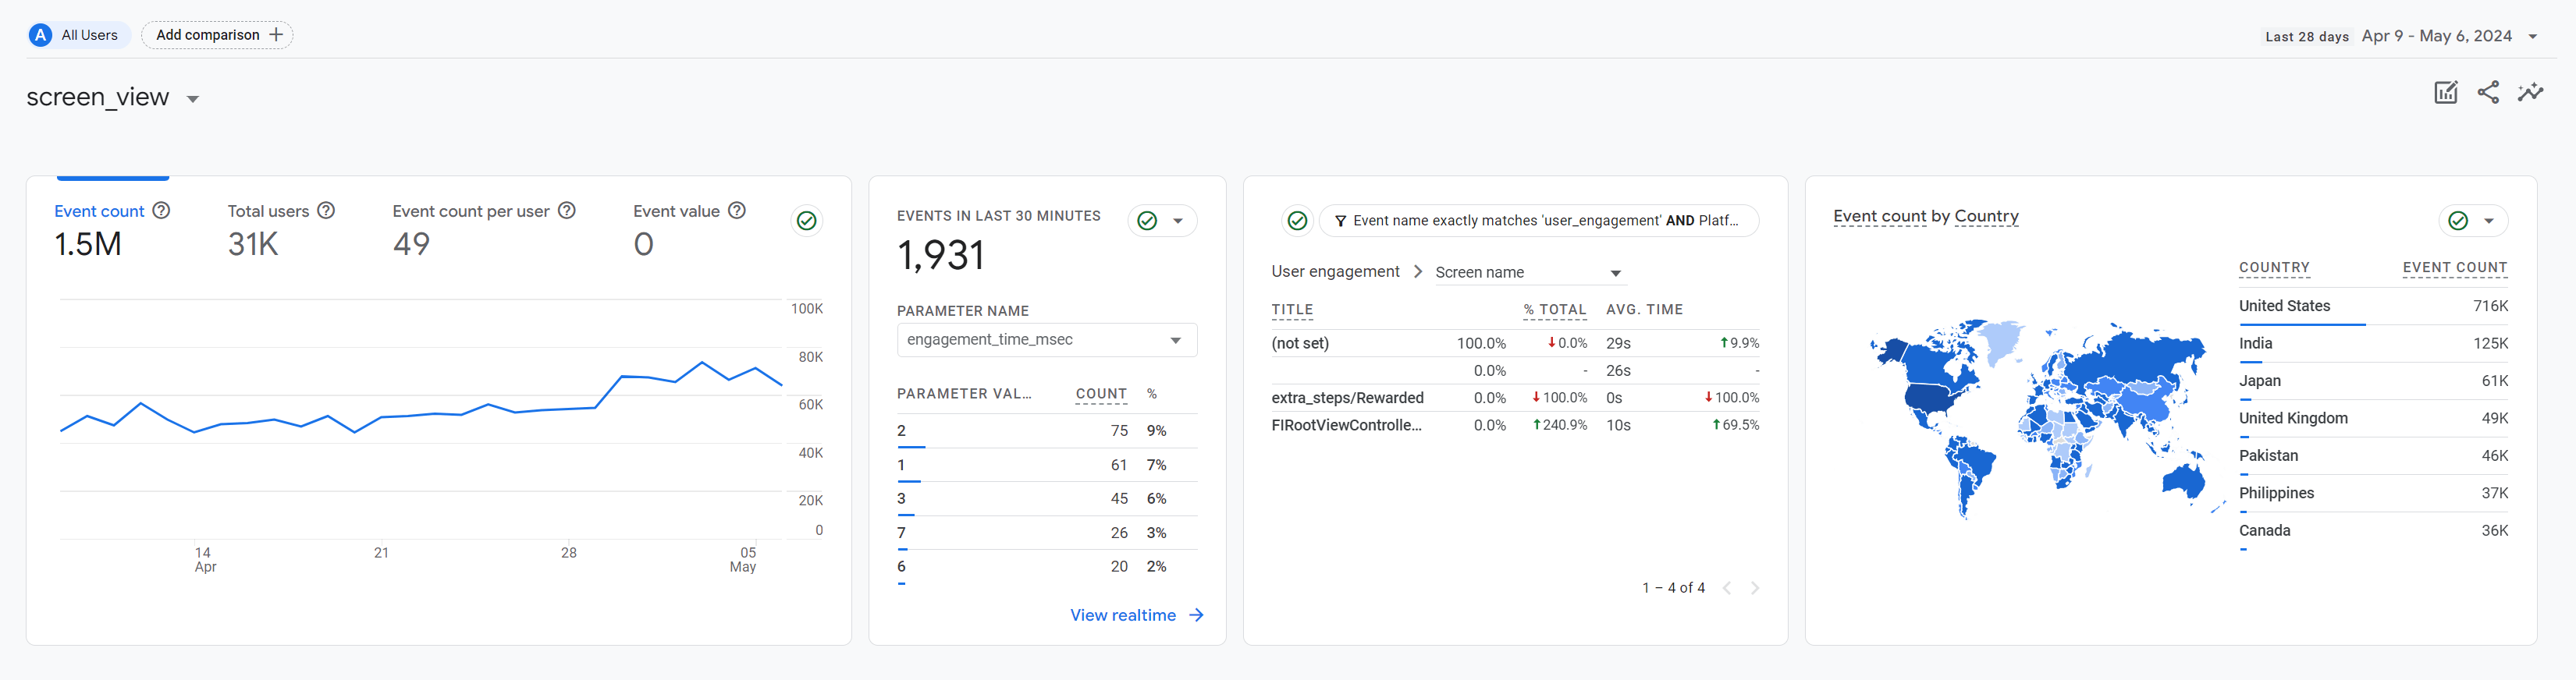
Events on your website/app
The big change from UA to GA4 is the use of events. Events are the actions people take on your website. Each event has a name to help you identify what actions people take.
You can see data like:
- Event count over time
- Average number of events per user
- Revenue generated from events
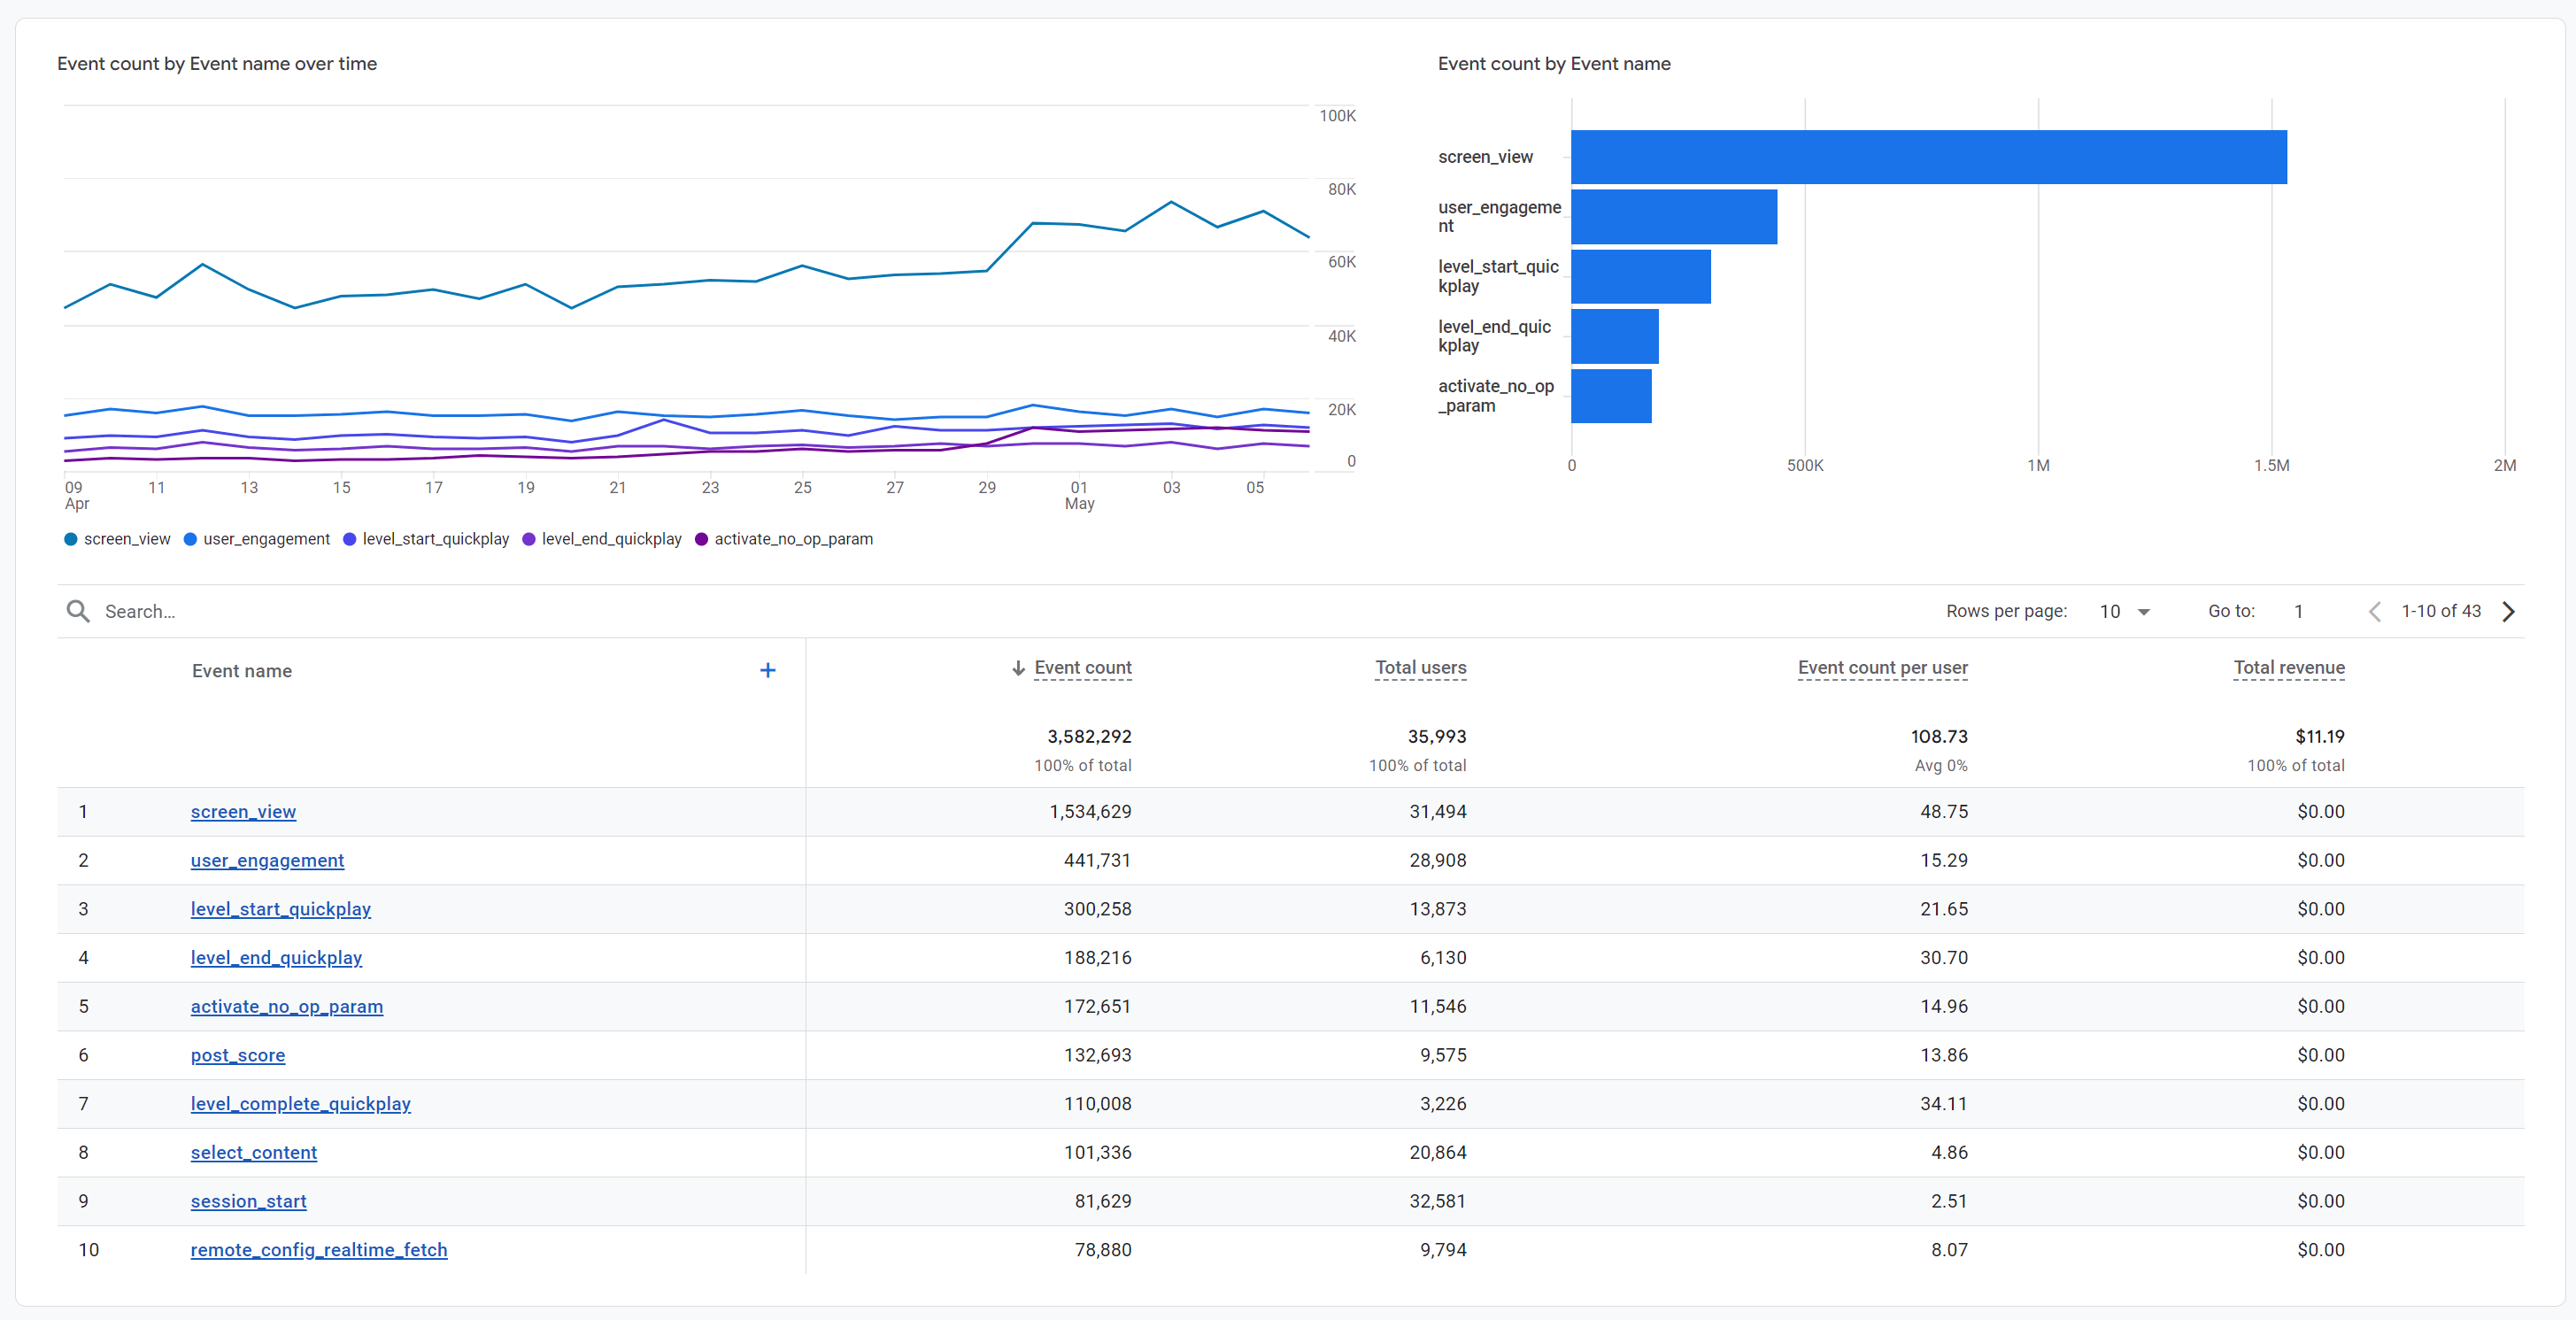
You can also get granular with individual events and view the data around them. You can see the event count, demographic data, and more for individual events. GA4 also allows you to customize the date range, so you can look at specific time periods of event data.
Where users come from
Google Analytics 4 helps you discover which strategies drive traffic to your website. You can see how much traffic is driven by:
- Direct
- Paid search
- Organic search
- Referral
- Social media
- and more!
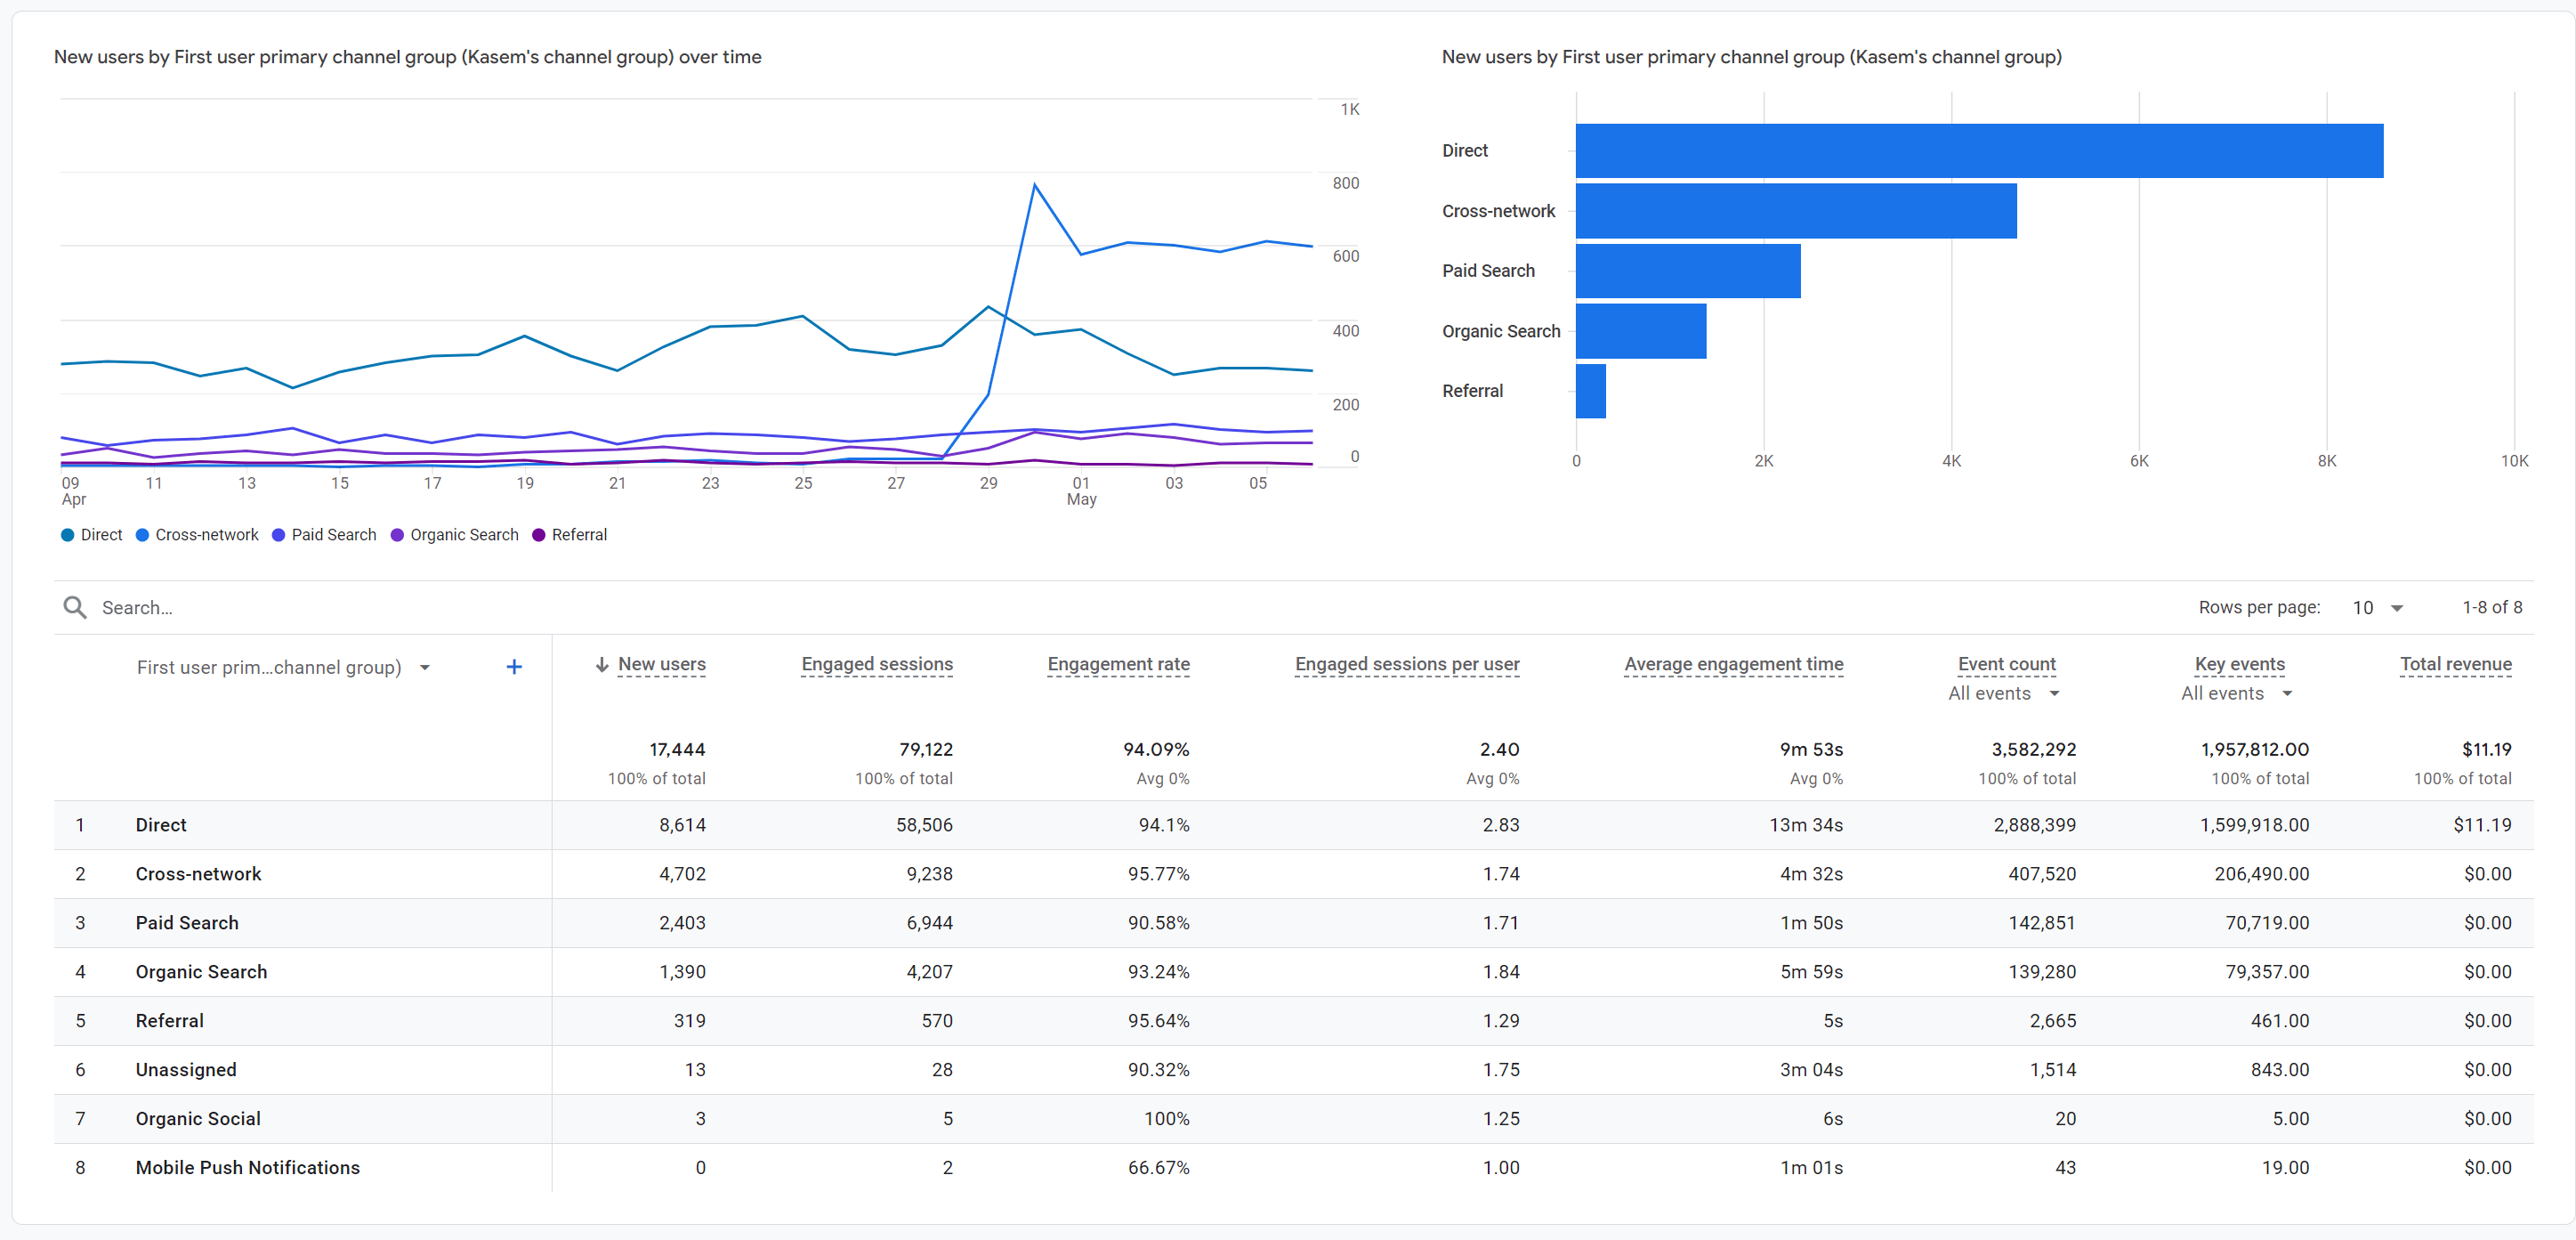
For each source, you can see data like engagement rate, engaged sessions, and more.
How to set up Google Analytics
So, how do you set up Google Analytics? Here’s how you can get started with using GA4:
1. Create a Google account
If you already have a Google account you use for Gmail, YouTube, Google Calendar, and other Google services, you can use it for your Google Analytics. You may also choose to set up a new Google account.
Make sure you use an account that you plan to keep for the foreseeable future and that only you have access to. To create a new Google account, go to accounts.google.com and follow the signup instructions.
2. Sign up for Google Analytics
Once you have your Google account, head over to Google Analytics. Follow these steps:
- Go into Admin
- Click Create
- Select Account
- Provide your account name
- Select your data sharing settings
- Set up your first property
3. Set up your first property
Once you reach the step to set up your first property, follow these instructions:
- Give your property a name (Ex. if it was your website, you could name it after your website)
- Select your reporting time zone and currency
- Click Next
- Select your industry category and business size
- Click Next
- Select how you intend to use Google Analytics (Ex. Generate more leads)
- Continue to Add a data stream
- Select either iOS app, Android app, or Web
- Follow the steps for set up for your specific data stream source
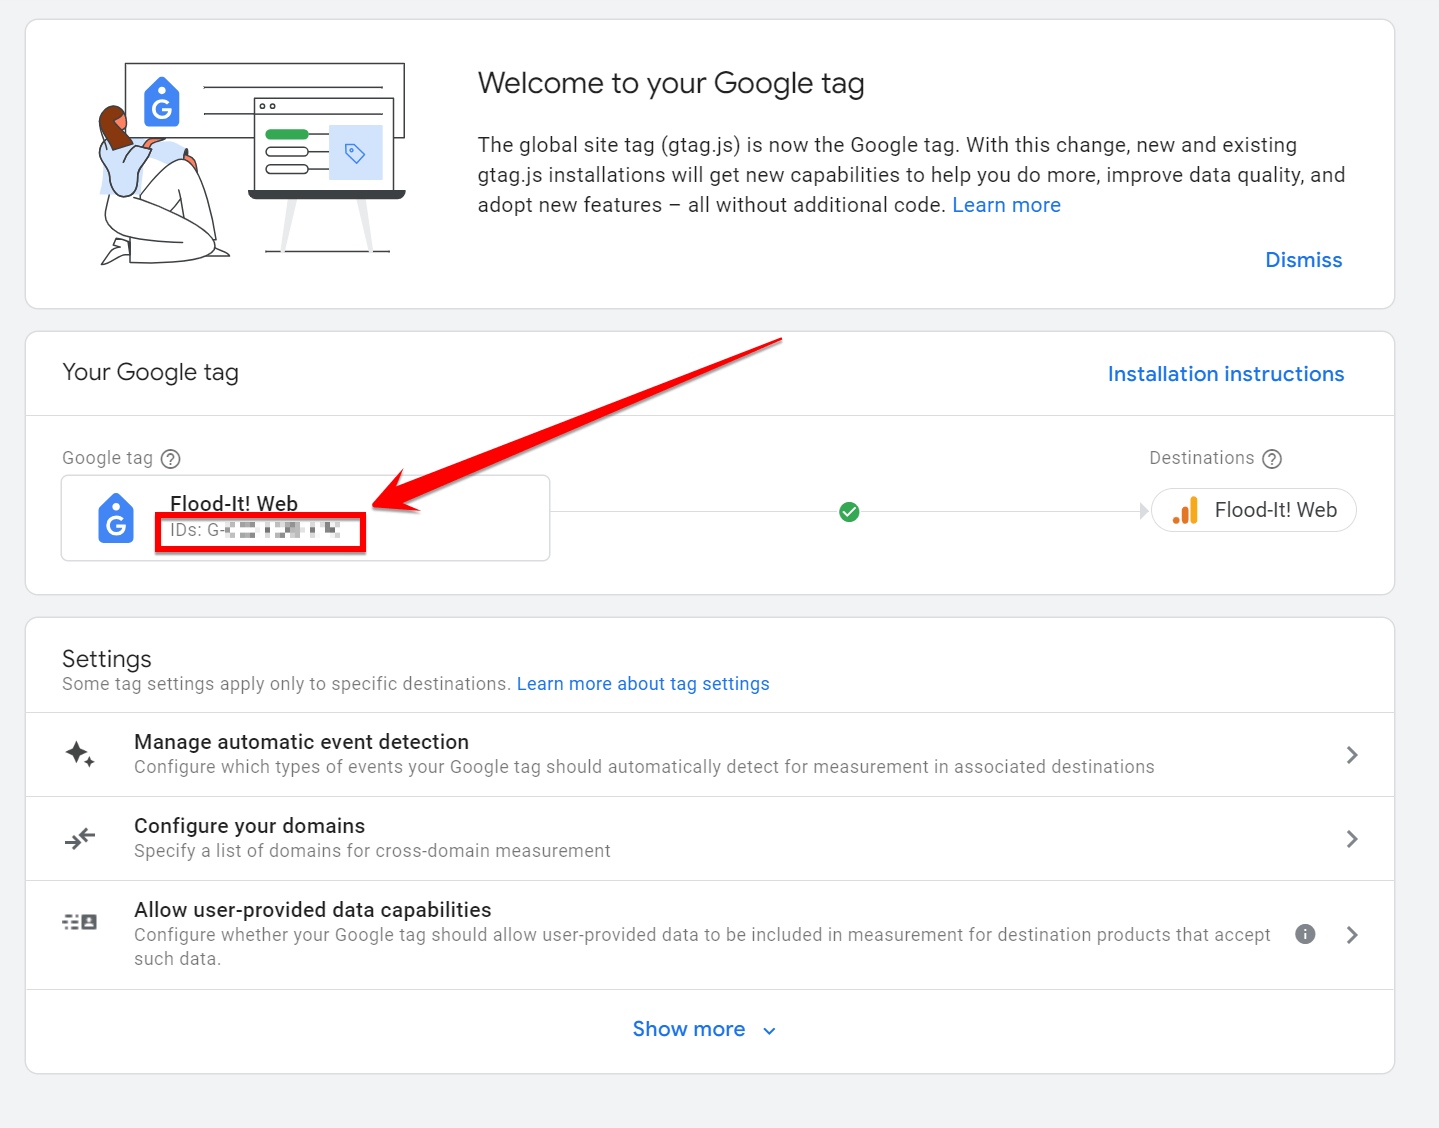
4. Add tracking code
Once you create a property and set up your data stream, you’ll get a unique tag to integrate into your properties, so Analytics can collect data. You’ll need to add your global site tag to every page that you want to track on your website.
Here’s how you can find the tracking code for your data streams:
- Go to Admin
- Under Property settings, go to Data collection and modification
- Click on Data streams
- Select the data stream you want the code for
- In the Google Tag section, click on Configure tag settings
- Under the Google tag, copy the code that starts with “G-” or “AW-“
Once you have your tag, you’ll have to manually install it into your web pages. Google provides instructions on how to install the tag manually or if you have a website builder.
To find the instructions, follow these steps:
- Go to Admin
- Under Property settings, go to Data collection and modification
- Click on Data streams
- Under the Google tag category, click on View Tag instructions
- Follow the instructions under either Install with a website builder or CMS or Install manually
How to use GA4 to improve your performance
Next up in this Google Analytics guide, let’s talk about how you can use GA4 to improve your performance. Here’s what you can do with GA4:
1. Analyze user behavior
Google Analytics can help you better understand user behavior on your website. You can use this tool to analyze how users interact on your website, so you can find areas where you need to improve the user’s experience.
For example, let’s say you look at the average engagement time per session of your web page and find that the average engagement time has been gradually dropping over the last few weeks. Seeing this data could indicate a problem on your website causing people to drop off and stop engaging.
By analyzing your audience’s behavior through GA4, you can find opportunities to improve website performance and drive better results.
2. Determine your best source channels
Another great use for Google Analytics 4 is identifying your best source channels. GA4 tracks sources that drive traffic to your website, which can help you see which campaigns drive the best results for your business.
Using this data, you can see which channels drive the most new users, engaged sessions, and which channels result in the most events.
This data can help you see what channels may need some improvements and tweaks to help drive better results.
3. Find new market opportunities
GA4 is a great resource to help you find new market opportunities. You can use event data to help you better understand what’s happening on your website or app, and find opportunities to expand.
For example, let’s say you were targeting males in the United States for a specific product page on your website. When you look at the event data, you see that the event count is high in Japan and higher with females.
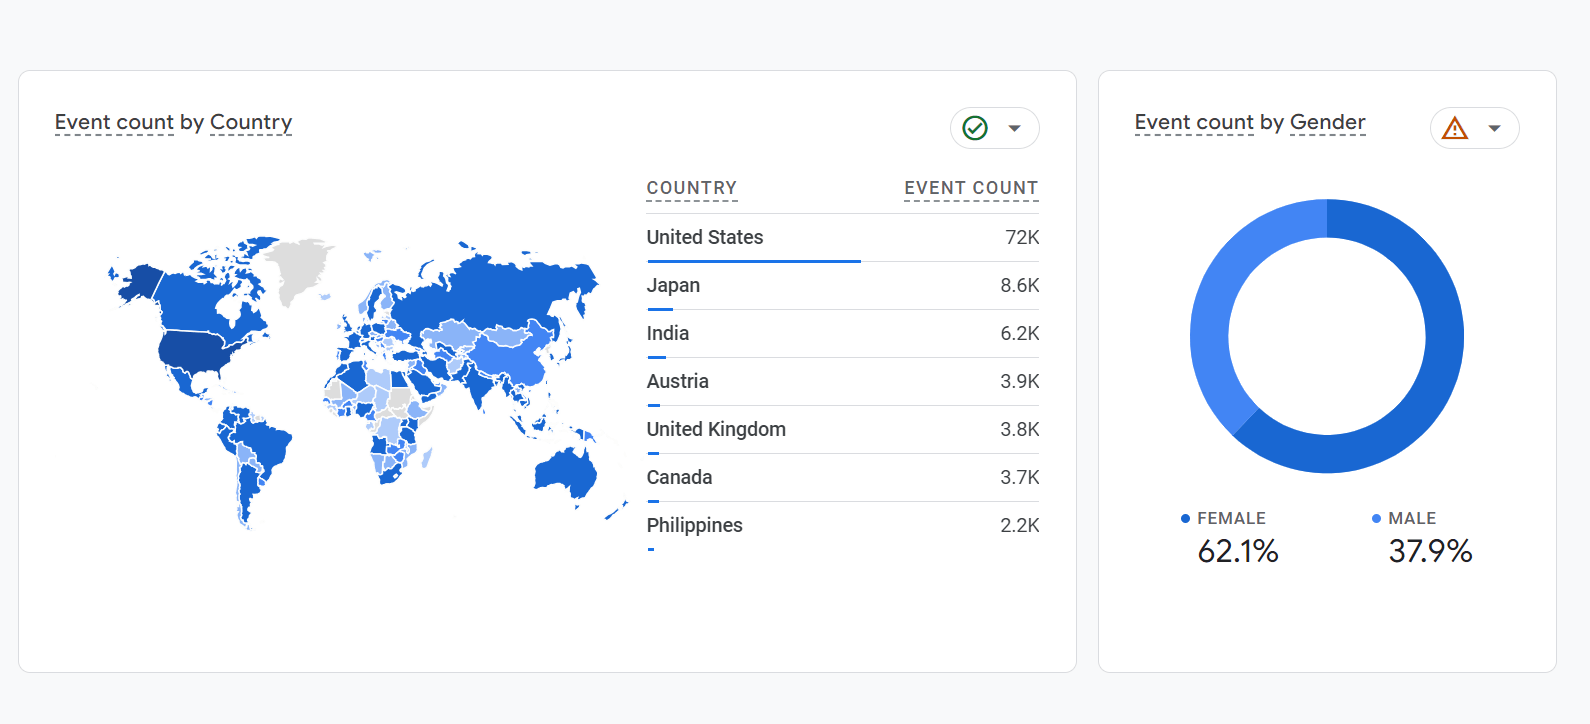
Previously, neither of these markets were on your mind, but now, using GA4, you see an opportunity to expand. You can optimize the page to tailor more to these demographics and create opportunities for boosted engagement.
This tool is great for helping you analyze audience event data and find new opportunities for your business.
Need help with Google Analytics 4?
This Google Analytics guide covered a lot of information, which can easily feel overwhelming, especially when we’ve only scratched the surface. If you want to take full advantage of Google Analytics for your business, consider investing in Google Analytics consulting services from WebFX.
Our team of 500 Google experts can help you set up your account, understand and analyze your data, and use your data to improve your website performance.
Contact us online or call us today at 888-601-5359 to see how we can help you take advantage of GA4!
-
 Sarah Berry is a Lead Web Marketing Consultant at WebFX. With more than 10,000 hours of experience, she offers practical insights and strategies you can use to grow your digital revenue. When she isn’t polishing her Time Magazine Person of the Year Award, she’s spending time with her flock of ducks.
 -

WebFX is a full-service marketing agency with 1,100+ client reviews and a 4.9-star rating on Clutch! Find out how our expert team and revenue-accelerating tech can drive results for you! Learn more
Try our free Marketing Calculator
Craft a tailored online marketing strategy! Utilize our free Internet marketing calculator for a custom plan based on your location, reach, timeframe, and budget.
Plan Your Marketing Budget
Share this article

Proven Marketing Strategies
Try our free Marketing Calculator
Craft a tailored online marketing strategy! Utilize our free Internet marketing calculator for a custom plan based on your location, reach, timeframe, and budget.
Plan Your Marketing Budget