If you’ve never heard of Google Data Studio reports, it’s time to listen up. As a business, marketing reports are a part of your every-day life. But as you know, all of that data can get overwhelming — fast.
So what if there was a way to import that data into clean reports that helped you visualize all of those numbers in one place? With Google Data Studio, you can. With Data Studio reports, you’ll be able to import data from Google Analytics, Google Ads, YouTube, and so much more to help you easily visualize data that’s important to your marketing campaigns.
On this page, we’ll talk about Google Data Studio reports, and even give you some Data Studio report examples to inspire you! To learn more, keep reading! Or, if you’d like to speak with a specialist, give us a call at 888-601-5359!
Google Data Studio reports — the basics
Before we dive into some examples of Data Studio reports, let’s first talk a little more about the platform.
Google created its free version of Data Studio in October 2018. Prior to its free release, Data Studio was a part of a paid data visualization tool called Google Data Studio 360. Since then, it’s been adopted by marketing agencies to help them create stunning graphic data reports for clients. Not only that, but some marketing teams even use Google Data Studio reports to show results to company executives. The tool is completely free, and you can create beautiful graphics reports that feature widgets, graphs, charts, and data imported from a number of platforms.
Google Data Studio allows you to import data from platforms like:
- Google Analytics (GA)
- Google Ads
- YouTube
- CloudSQL
- Search Console
- And so much more!
7 Data Studio report examples to inspire the way you organize data
With so many options available through Google Data Studio, how do you know what info to include? Where to place widgets? How to make your report look stunning?
We’ve got you covered with our seven Google Data Studio report examples.
1. Search Ads 360
If you’re looking to pull data for search ads, check out this Data Studio report example — Google’s Search Ads 360 dashboard. It includes everything from visibility to engagement to sales, and even offers detailed data to further break down the numbers. 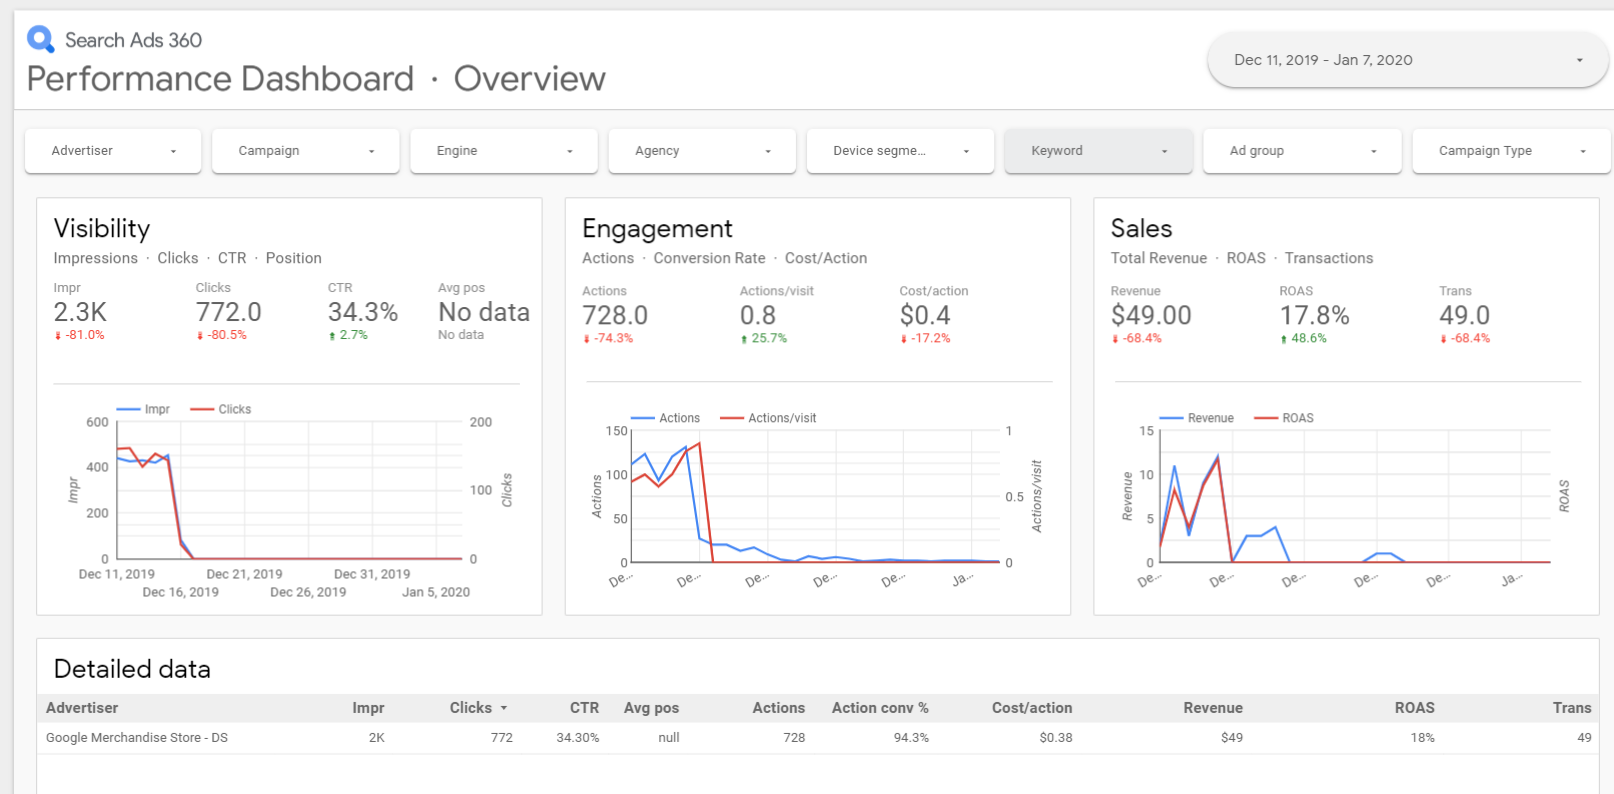 In the visibility block, you’ll be able to see:
- Impressions
- Clicks
- Click-through-rate (CTR)
- Average position
In the engagement section, you’ll see data like:
- Actions
- Actions per visit (conversion rate)
- Cost per action
And within the sales section, you’ll see data for:
- Revenue
- ROAS (return on ad spend)
- Transactions
How a Search Ads 360 report benefits your business: When you pull this kind of report, you’ll be able to improve your ads based on the metrics provided. For example, impressions, clicks, and CTR can help you determine the success of your ad. When those metrics are low, you’ll have an idea that something needs to change.
With your engagement data, you’ll be able to tell if your wasting money by your cost-per-action metric and your conversion rate is huge for determining how effective your ads are. Not to mention, you can compare the revenue of ads year over year to see your improvements.
2. GA audience overview
Determining who visits your website is a crucial part of marketing. When you know more about your site visitors, you can provide them with exactly what they’re looking for from your business. This Data Studio report example provides tons of data about your audience including:
- Language
- Country
- City
And information about website visits including:
- Users
- New users
- Number of sessions per user
- Sessions
- Pageviews
- Pages per session
- Average session duration
- Bounce rate
- New visitors vs. returning visitors
 How audience overview reports benefit your business: You have to know exactly who you’re selling to if you want to sell effectively. This report can help you determine if you’re targeting the right audience with your ads, if your targeting needs to change, and if your ads are effective. Targeting is one of the most important elements of your ad campaign and this report will help you get it right.
3. GA acquisition overview
Where is your traffic coming from? If you want to express things like referral traffic, social traffic, paid search traffic, and more, this is a great Data Studio report example for you. You’ll be able to see metrics like these (acquired per source):
- Number of sessions
- Number of users
- Number of new users
And metrics like these (based on source):
- Bounce rate of users
- Pages per session
- Average session duration
- Goal conversion rate
- Goal completions
- Goal value
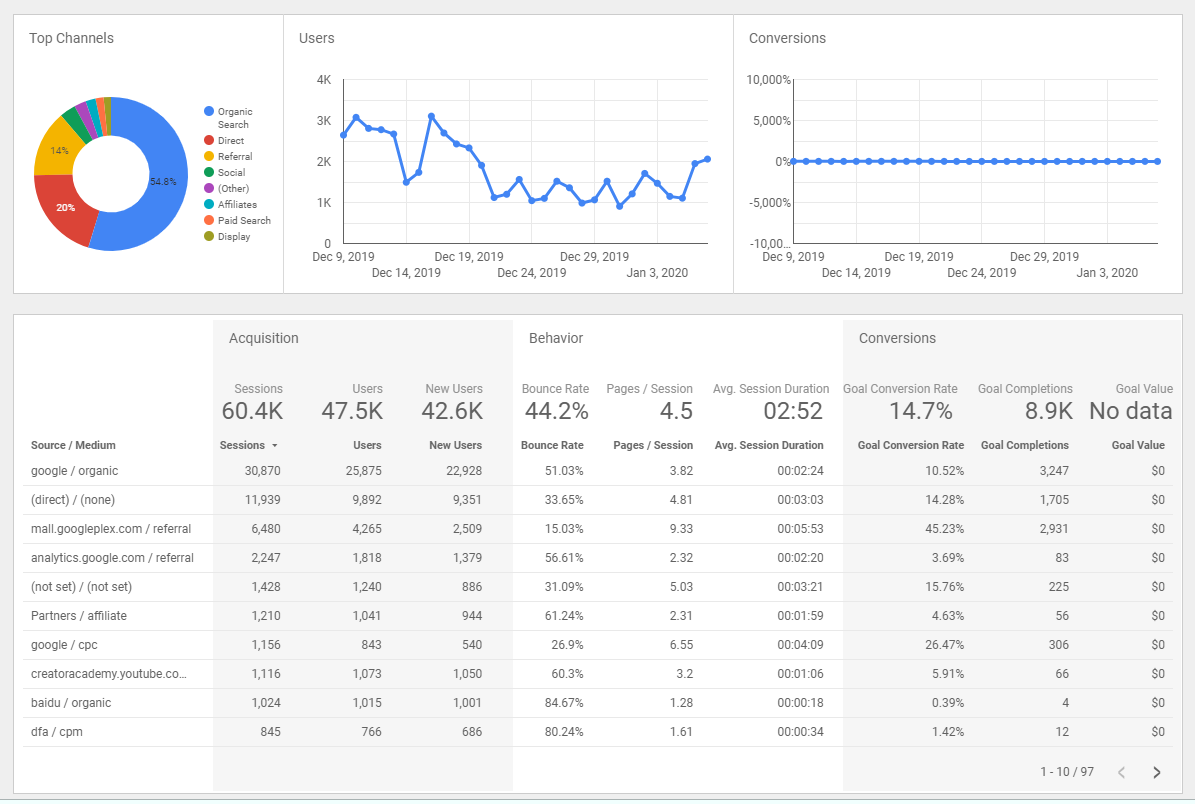 How acquisition overview reports benefit your business: It matters where your traffic comes from and this report allows you to take a detailed look at just that. When you know where your website traffic comes from, you can adjust your marketing budget to cater more to the channels that deliver. For example, if you find that you have the most sessions from paid search traffic, but you’re putting a ton of time into your social presence, this report can tell you that you might want to put more effort into your paid efforts rather than social.
4. GA behavior overview
How your audience acts on your site helps you determine what kind of user experience they want. For example, if they bounce from your website after just a few seconds, they obviously didn’t have the experience they desired. Or if you notice that YouTube content isn’t getting as much attention as you had hoped, you can draw the conclusion that your content might not be what your users want.
That being said, the GA behavior overview data report can help you gain insight into how users respond to your site. You can outline data like:
- Pageviews
- Unique pageviews
- Average time on page
- Bounce rate
- % exit
- How visitors are dispersed throughout your pages
- Page title with page views
- Content group with page views
- Search term with page views
- Event category with page views
 How behavior overview reports benefit your business: Without knowing how your audience acts on your site, you’re essentially marketing blind. When you do have this information though, you can make changes to your website to increase metrics that you might be lacking. For example, if you see that your page views are down 50% year over year, you might want to take out the records and see what you were doing a year ago — and return to that strategy.
You can even see your most popular pages and draw conclusions about why they’re popular, determine why users might bounce from your page, and more.
5. Google Ads overview report
Understanding your ads is a crucial part of success. When you pull a report like this Google Ads Data Studio report example, you’ll be able to outline info that’s most important to the success of your ads. You’ll be able to incorporate data like:
- Clicks
- CTR
- Impressions
- Conversions
- Conversion rate
- Cost per conversion
- Cost per click (CPC)
- Average CPC
- Average CPM
- Top campaigns based on CTR, average CPC, and cost per conversion
- Device breakdown by clicks, cost, and conversions
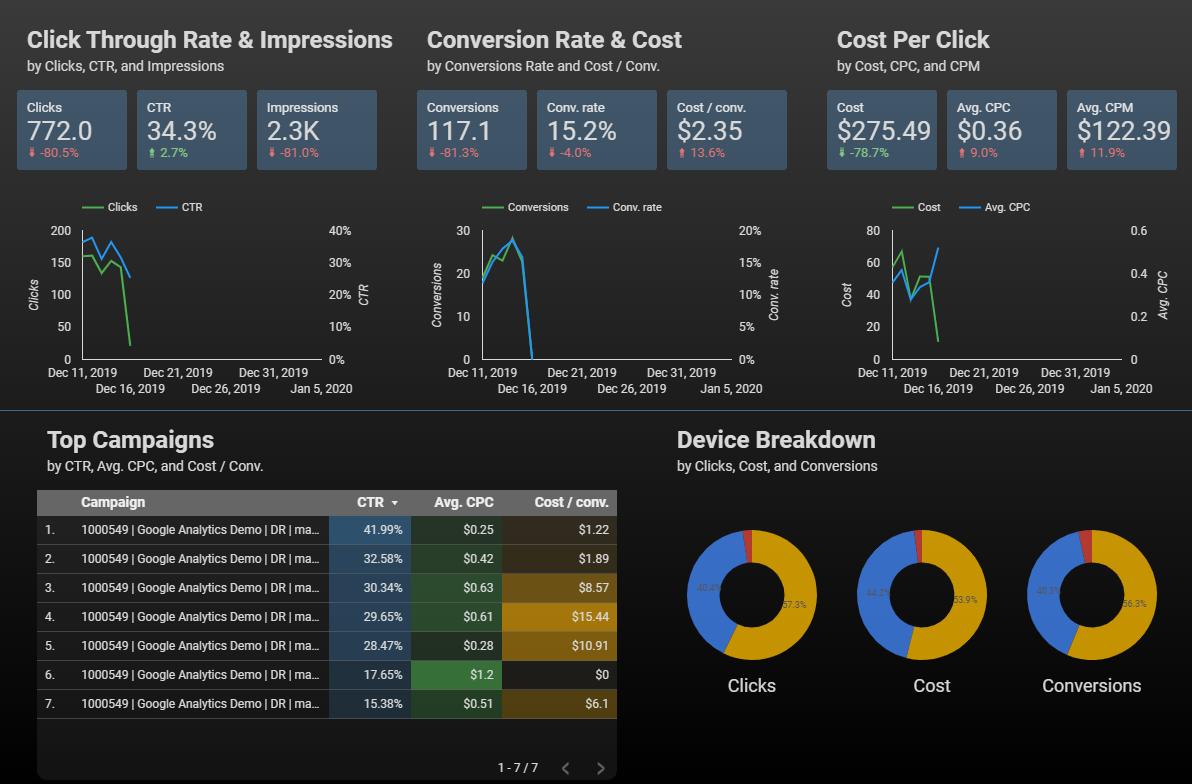 How Ads overview reports benefit your business: Similar to marketing, if you don’t check out the metrics behind your ads, your efforts are lost. A Google Ads overview report allows you to take a deep dive into the success of your ads. When you do so, you’ll be able to spot small details that you might need to change in order to create more successful advertisements.
For example, if your conversion rate is low, you know your ads need a tweak. Start with small tweaks and pay attention to future reports to see what makes a difference. Before you know it, you’ll end up with a converting ad — just because you paid attention to the metrics on your report.
6. Ecommerce report
If you own an ecommerce store or provide marketing for an ecommerce store, keeping track of data is one of the most important jobs. Outlining that data is even more important, which is why we think this is a fantastic Data Studio report example. With an ecommerce report, you’ll be able to see information like:
- Sessions
- Product detail views
- Product adds to cart
- Product checkouts
- Revenue based on device
- Ecommerce conversion rate
- Revenue by city
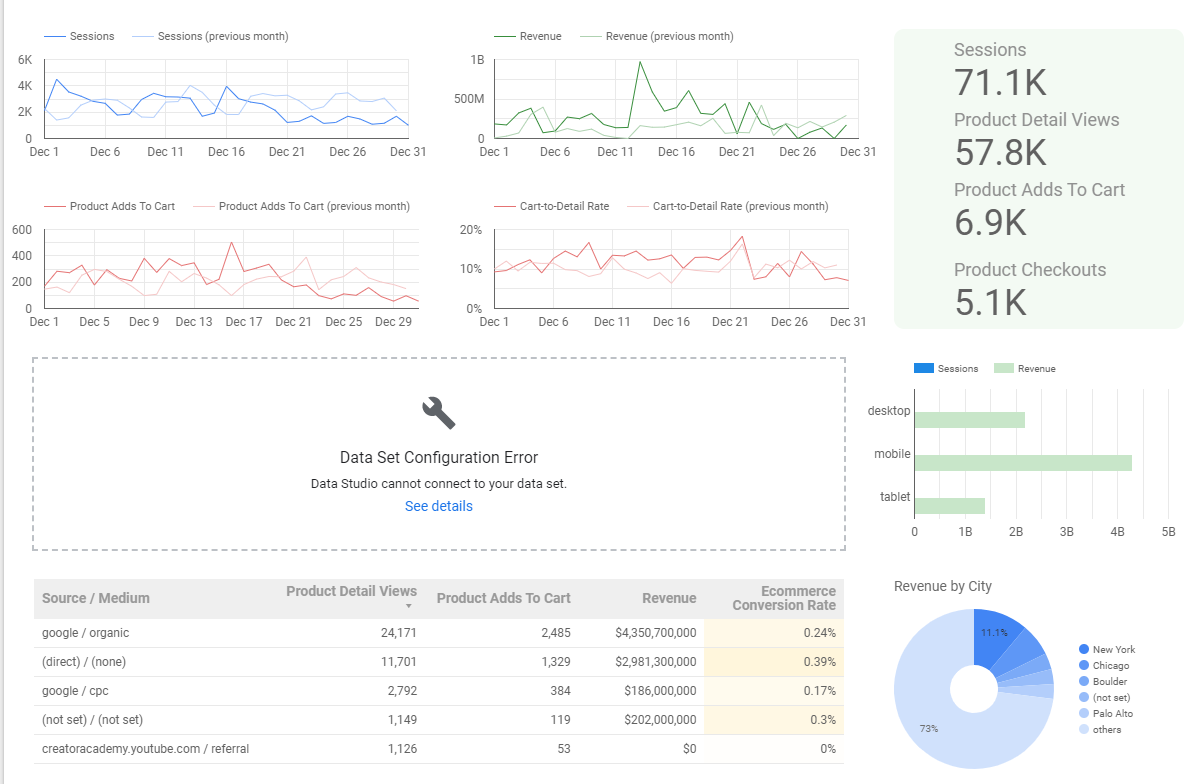 How ecommerce reports benefit your business: Which of your products are the most popular? Which products make it to your cart? Which cities buy from you most often?
You can answer all of these questions with your ecommerce report. It’s important to understand what products users are interested in and how many people actually check out with that item. For example, if a certain item only makes it to users’ carts but never actually ends up in a purchase, there might be something wrong with that item that you need to consider.
A metric like revenue based on device can help you understand what device you need to cater to when developing your site pages in order to provide users with the best possible experience.
7. YouTube channel report
Although YouTube offers analytics, it’s arguably more effective when you have all of the data in one place. On your YouTube channel Data Studio report example, you’ll be able to visualize data including:
- Views
- Watch time
- Video shares
- Top videos watched
- Likes added and removed
- Subscriptions added and removed
- Dislikes added and removed
- User comments
- Video comments
- Top countries by views
- Top US states by views
 How YouTube channel reports benefit your business: Although YouTube offers its own analytics, looking at all of your YouTube channel data in one place is extremely beneficial. You’ll be able to compare metrics month to month to determine what’s working and what isn’t. If you find that a specific metric is increasing or decreasing, you can pinpoint what you’re doing right and what you need to change.
Google Data Studio report example elements
Curious about what you can include in your Data Studio report?
Check out the elements below!
Filter control
In this Data Studio report example, you can see the different filter controls that you can utilize in Google Data Studio. These filters allow you to see your data through different lenses with the use of:
- Multi-select filters
- Single-select filters
- Expanded filters
- Collapsed filter controls
In this example, you can filter this data by country and size. 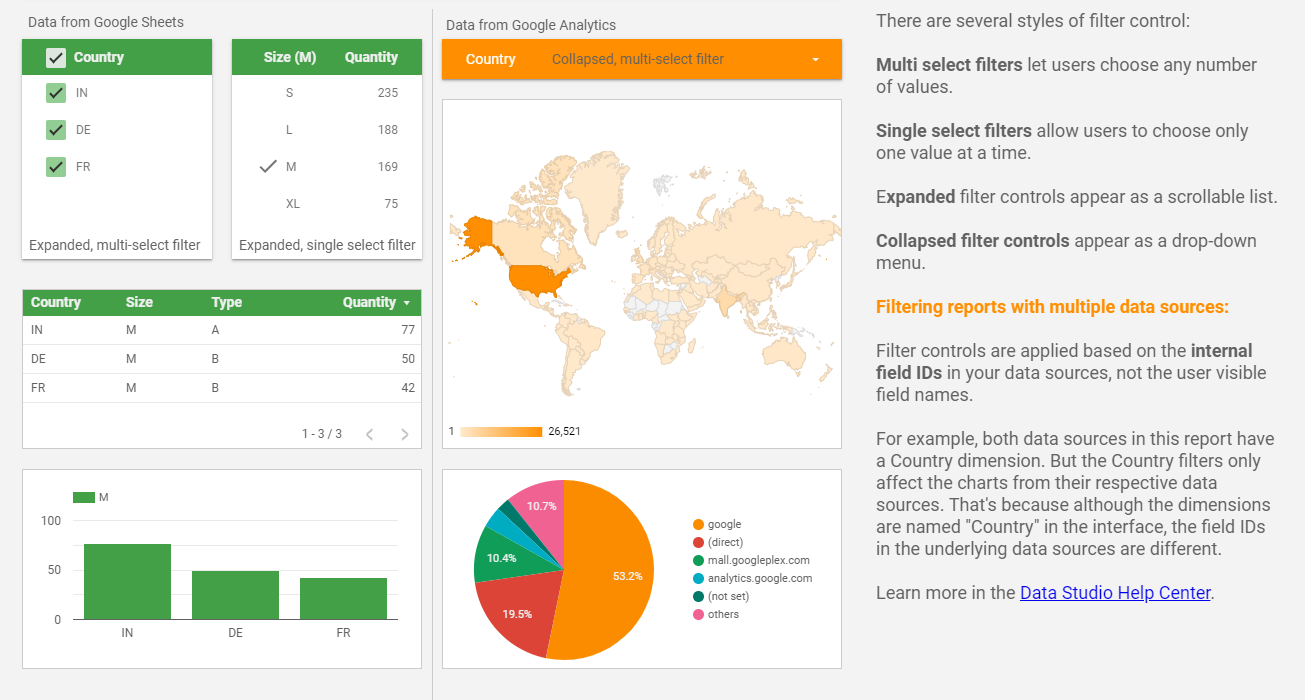
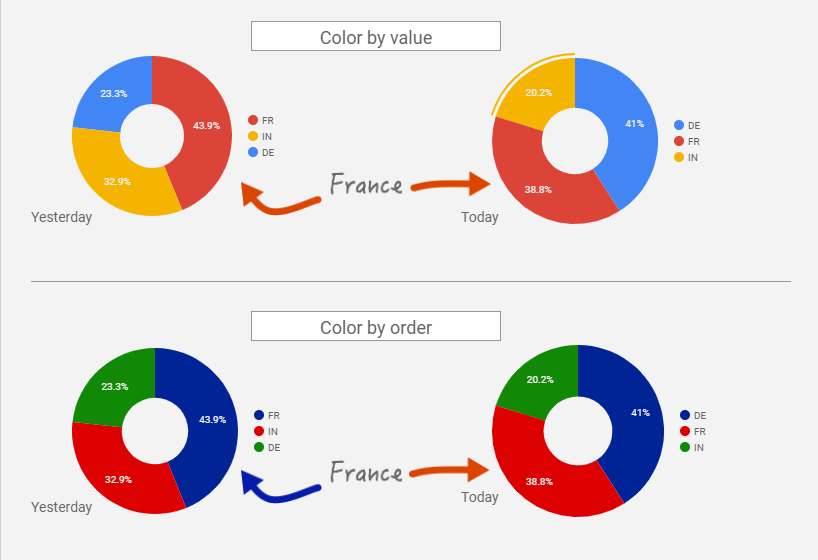
Data coloring
Everyone loves a splash of color, and in this Data Studio report example, you can see that the use of color is welcomed on your reports. You have two options when coloring your charts and graphs:
- Color by value: assigns series colors based on the dimension value.
- Color by series order: assigns colors to data according to its position in the charts.
Layout grid
If you want to use a grid style to organize your data, this Data Studio report example is for you. It shows how you can use adjustable grid sizes to standardize your reports.  With the template that Google provides, you can put in your own Google Analytics data and create a stunning report.
Calculations
Including calculations on your report can help you, or your client, see the whole picture.
It gives a complete set of data from beginning to end. 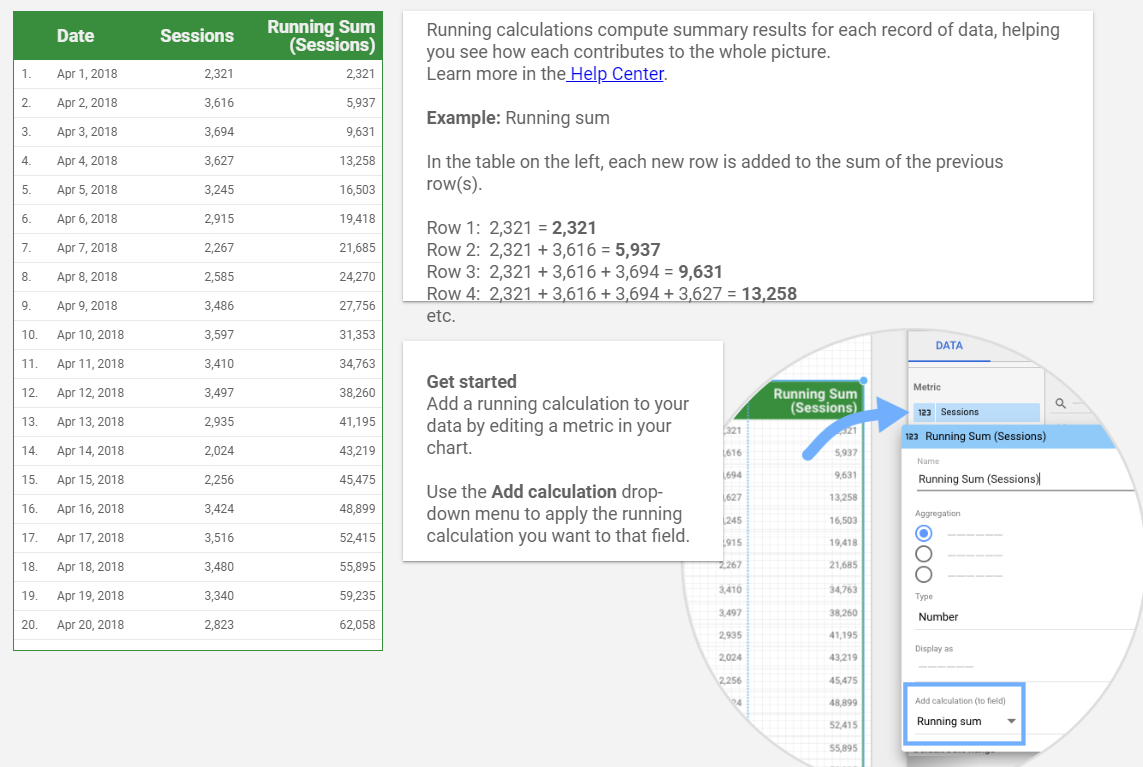
Data blending
If you’re pulling data from different sources, you can benefit from visualizing both of the sources of the same data, together. Google provides the example of blending two different GA data sources to measure performance on your app and website with a single chart or graph.
Want to learn more about Data Studio reports?
Whether you’re new to marketing or a seasoned pro, there’s no time like the present to learn a new skill. Google Data Studio can benefit you and your business in a variety of ways, and the first step is learning how to use it. If you have any questions about Data Studio, how it’s used, or how to create your own stellar reports, feel free to contact us online or give us a call at 888-601-5359!
-
 Sam has been writing for WebFX since 2016 and focuses on UX, crafting amazing website experiences, and digital marketing In her free time, she likes to spend time on the beach, play with her cats, and go fishing with her husband.
 -

WebFX is a full-service marketing agency with 1,100+ client reviews and a 4.9-star rating on Clutch! Find out how our expert team and revenue-accelerating tech can drive results for you! Learn more
Try our free Marketing Calculator
Craft a tailored online marketing strategy! Utilize our free Internet marketing calculator for a custom plan based on your location, reach, timeframe, and budget.
Plan Your Marketing Budget
Share this article

Proven Marketing Strategies
Try our free Marketing Calculator
Craft a tailored online marketing strategy! Utilize our free Internet marketing calculator for a custom plan based on your location, reach, timeframe, and budget.
Plan Your Marketing Budget