Wondering how to tailor infographics for different audiences? Well, you’re in the right place!
Different channels have different audiences! Just because a design resonates strongly with one set of users doesn’t guarantee it’ll be that effective in other environments.
For this reason, it’s essential to consider your audience when you’re planning and creating your infographics. Your infographic may live on your main website, but you can also publish it on different platforms, like LinkedIn, Facebook, and Pinterest, to drive traffic to your original post.
Key Takeaways
- LinkedIn: Take a more formal approach, include more information, choose topics that build upon your audience’s existing knowledge, use technical terms, and provide stats and sources.
- Facebook: Be more creative, appeal to a wider audience, choose topics that resonate with users and generate conversation, pick evergreen topics, and showcase a cropped version of your graphic with a link to the full thing.
- Instagram: Explore the fun side of your company, ensure text sizing is readable on mobile, and use high-quality imagery.
- Pinterest: Use high-quality images, utilize modern design trends, include plenty of information, and showcase DIY and how-to topics.
- YouTube: Transform your infographic into an interactive video, take advantage of your video run time and include more information, and create explainer videos and step-by-step tutorials.
While you may cover the same general topic across all channels, you’ll want to tailor your graphics to maximize their ability to resonate with your audiences.
If users follow your business on multiple platforms, they might get bored if they see the same exact graphic multiple times. Switching it up can keep them intrigued and give you additional opportunities to draw them in!
Let’s take a deeper look at the different channels available for sharing infographics and explore some strategies you can use to maximize the effectiveness of your designs.
Don’t miss our Marketing Manager Insider emails!
Join 200,000 smart marketers and get the month’s hottest marketing news and insights delivered straight to your inbox!
Enter your email below:
Inline Subscription Form – CTA 72
“*” indicates required fields
(Don’t worry, we’ll never share your information!)

1. LinkedIn
LinkedIn’s audience is comprised of industry professionals, and you’ll encounter people from entry-level all the way up to CEO.
While the tenure and experience may vary between individuals, all of these users have one thing in common — they have pre-existing knowledge of the industry. Users on LinkedIn are looking for a deeper understanding of topics, so the more detail, the better!
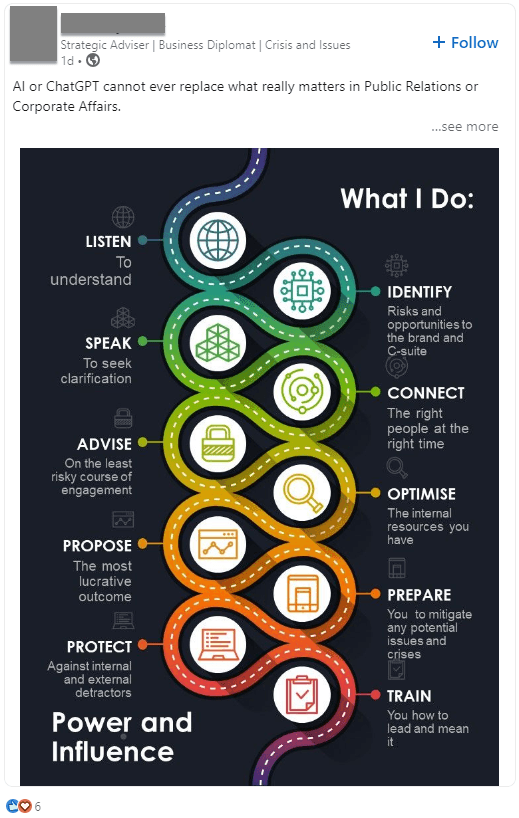
You can even include more technical terminology. In an environment like LinkedIn, there’s no need to over-simplify the information to keep it accessible to the general public — we’ll touch on that a bit later.
Users on LinkedIn will most likely be accessing your graphic during the workday, so you’ll want to take a more formal approach here.
- Do: Include more information.
- Do: Choose topics that build upon your audience’s existing knowledge.
- Do: Provide statistics and sources to build trust with users.
- Do: Use technical terminology when applicable.
- Topic ideas: Industry trends, complex processes explained, timelines, data visualizations, case studies.
2. Facebook
People generally look to Facebook for entertainment and a sense of connection. Facebook users come from all walks of life, so you’ll want to make sure your topic is broad enough to appeal to a wider audience.
You’ll still want to provide useful information to your users, but you can do it through a more creative lens here.
On Facebook, the visuals tend to carry more weight than the information itself. Your users will encounter your graphics during their free time in a more relaxed way.
Users aren’t looking for a super intensive thinking session here, so you need to communicate your ideas quickly and clearly. The more relatable your topic is, the more likely users will share it!
- Do: Choose topics that resonate with users.
- Do: Choose topics that generate conversation.
- Do: Be inclusive. Even if most of your target audience is 18–24 years old, you don’t want to alienate your other audience segments by being too specific.
- Do: Pick evergreen topics to increase the lifespan of your infographics.
- Do: Showcase an abridged or cropped version of your infographic w/ a link to the full version. Seeing a super zoomed-out image isn’t the most effective way to draw users in, so showcase a snippet that will leave users wanting more!
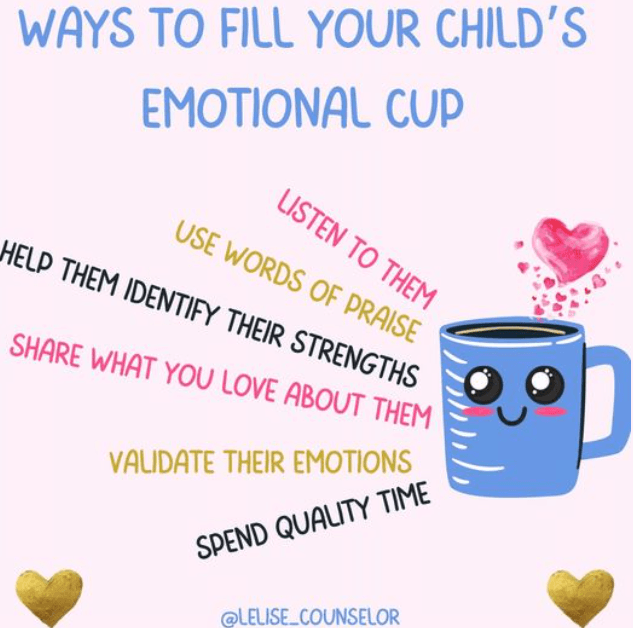
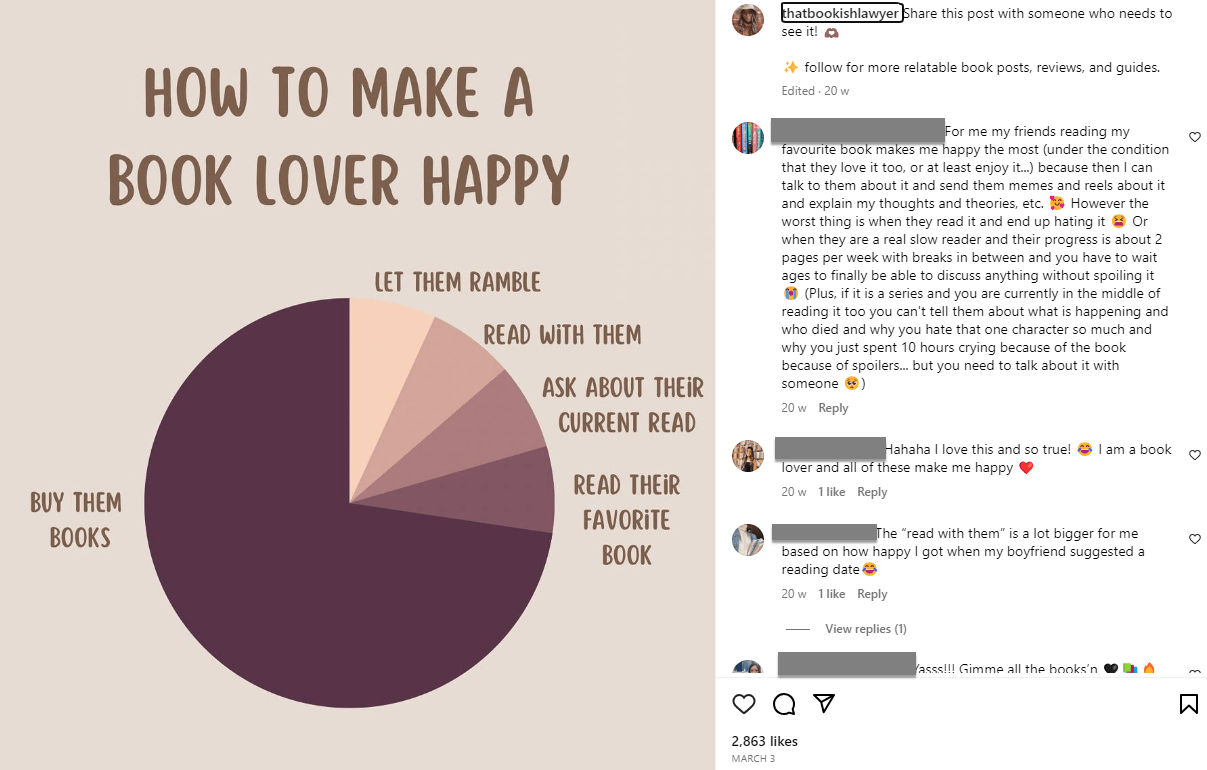
3. Instagram
Instagram’s audience composition is a bit more unique. Some users use the platform for photo-sharing, while others are there to do business.
While there’s not a gender difference between Instagram and Facebook, Instagram users do tend to be younger than Facebook users.
This could influence the angle you approach your topic from.
- Do: Explore the “fun” side of your company.
- Do: Keep in mind that Instagram is a mobile-first platform — you’ll want to ensure your text sizing is large enough to read on mobile.
- Do: Use high-quality imagery (Instagram IS an image-based platform, after all).
- Topics: Close-ups and product details, step-by-step guides and how-tos, and before-and-after transformations.
There are also several different ways to distribute content, which can impact how you develop your infographic.
Let’s take a closer look.
Instagram Story
Instagram Stories are a very popular way to advertise products. They have a vertical format, so you’ll need to organize your information in a way that uses that layout effectively.
Instagram stories are usually comprised of multiple images, so if you can’t fit everything on one screen, you can continue the data on the next graphic!
Instagram post
Instagram posts usually have a more boxy layout, so you’ll need to do some reformatting depending on which presentation you choose.
Instagram posts can be made of one or multiple images. If you opt to include multiple images in your post, it can be helpful to provide a directional cue to encourage your users to swipe!
Carousels
Instagram carousels utilize multiple photos and lend themselves really well to informational or process-related infographics. These carousels are interactive, so users spend more time looking at them than at regular posts on their feed.
4. Pinterest
As a primarily image-based platform, Pinterest lends itself really well to infographics. Users are primarily female and are looking to discover new ideas.
They are likely to make purchase decisions based on the information they gather. In fact, 82% of Pinterest’s active users claim to have bought products based on the brand’s Pinterest content.
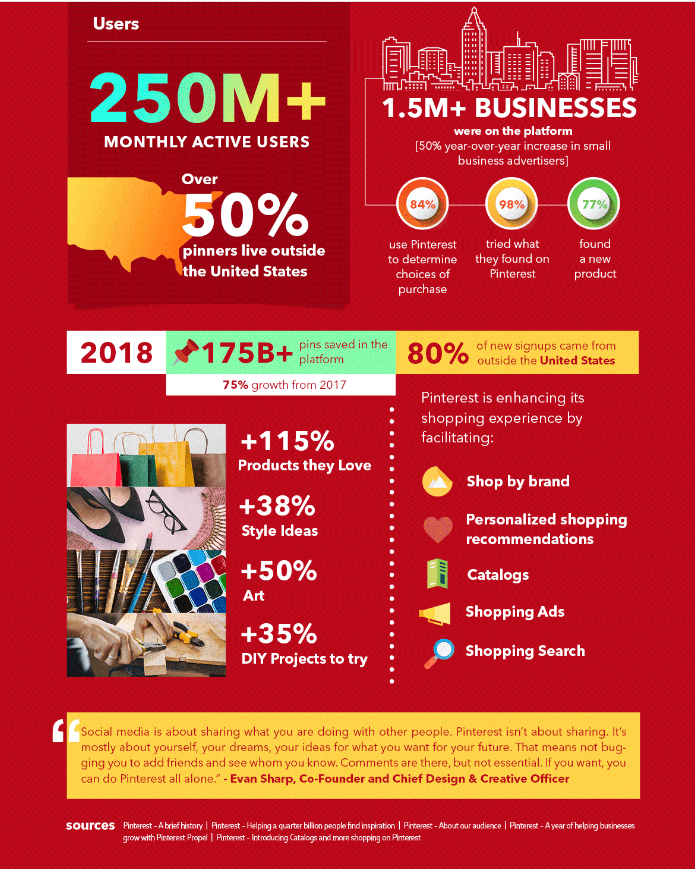
As most of the topics searched on Pinterest aren’t brand-specific, your infographic can have a huge influence on users’ final purchasing decisions!
- Do: Use high-quality images.
- Do: Use modern design trends.
- Topics: How-to, DIY, trends.
Not only is Pinterest a great place to share your infographics, it’s chock-full of inspiration to keep your designs fresh!
Ensuring your infographic is aesthetically pleasing (as well as informational) can increase your audience! While it may not be the best idea to test out a new design trend on LinkedIn, Pinterest is a great place to experiment to ensure your designs really stand out!
5. YouTube
YouTube is exclusively a video platform, making it a little different than the other ones we’ve looked at. However, infographics still have their place in this realm in the form of motion graphics!
Transforming your infographic idea into an interactive video is a great way to dive deep into a topic! While these are definitely more time-consuming than static graphics, these videos tend to be more memorable for viewers! Viewers retain 95% of a message when they watch it in a video, compared to 10% when reading it in text.
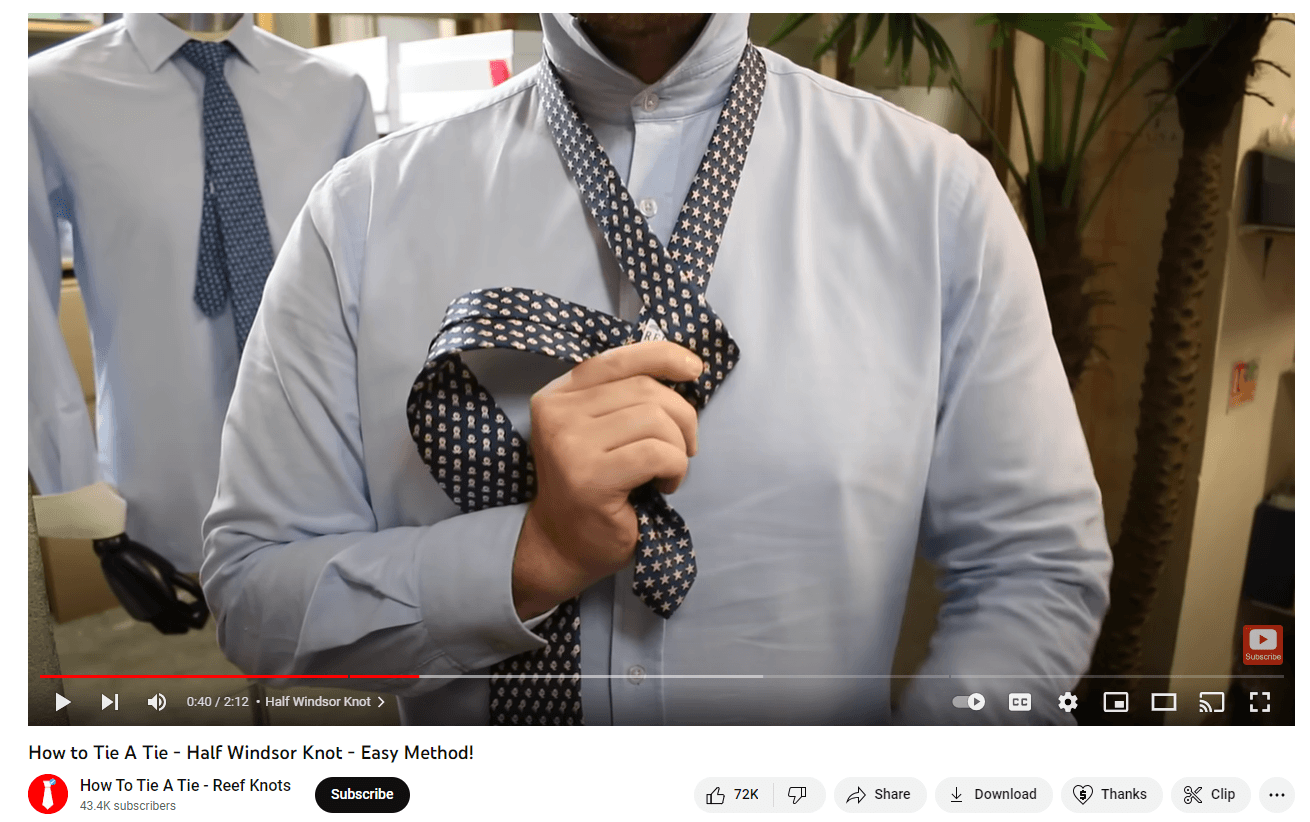
YouTube users are expecting to spend more time watching videos than they would on other platforms. These users are looking to learn something or be entertained.
- Do: Take advantage of the time and go into detail.
- Topics: Explainer videos highlighting products or services, educational step-by-step tutorials.
Good agencies have more than 50 testimonials.
Great agencies have more than 100 testimonials.
WebFX has over 1,100+ glowing client testimonials.
See What Makes Us Stand out
Create personalized infographics that engage your audience with WebFX
Having so many platforms at your disposal gives you multiple opportunities to repurpose existing content.
Regardless of how many platforms you publish your infographic on, though, if it doesn’t resonate with your audience, then it’s not achieving its intended goal.
At WebFX, we offer professional infographic design services to help you create custom, personalized infographics that engage your audience across multiple channels and platforms.
Want to learn more or get started? Give us a call at 888-601-5359 or contact us online to speak to one of our specialists!
-
 Jaci is a Lead Designer at WebFX with a B.S. in Graphic Design and a passion for pushing creative boundaries (with numerous Horizon Interactive Awards to show for it!). When she’s not crafting pixel-perfect designs, Jaci finds inspiration in the freedom of running and the expressive power of painting.
 -

WebFX is a full-service marketing agency with 1,100+ client reviews and a 4.9-star rating on Clutch! Find out how our expert team and revenue-accelerating tech can drive results for you! Learn more
Try our free Marketing Calculator
Craft a tailored online marketing strategy! Utilize our free Internet marketing calculator for a custom plan based on your location, reach, timeframe, and budget.
Plan Your Marketing Budget
Share this article

Looking for More?
Get expert ideas, industry updates, case studies, and more straight to your inbox to help you level up and get ahead.
"*" indicates required fields

Try our free Marketing Calculator
Craft a tailored online marketing strategy! Utilize our free Internet marketing calculator for a custom plan based on your location, reach, timeframe, and budget.
Plan Your Marketing Budget